The previous series, "TFT Characteristic Parameters," was about how to read the curve. Across eight parts we looked at where to put the threshold voltage on a single transfer curve, how to measure the slope, and which expression to use when extracting mobility. Those eight parts rested on one assumption — that the curve sits where it belongs.
This series begins where that assumption breaks. Measure a real device and the curve comes out unlike the textbook picture. The slope lies down, the height drops, the floor lifts, the whole thing has slid sideways. The eight parts of "TFT Anomalies and Reliability" follow what has changed inside the device when the curve is not where it belongs.
This first part draws the map. The word "different" comes in a few typical shapes, and each of them points to a different change inside the device. We will walk through six of them in turn, going only as far as "the curve looks like this → what does that mean has physically changed."
The condition values in the text are examples chosen to show the arithmetic, not the specifications of any particular company. Every figure quoted has been verified in the public literature, and the sources are listed at the end.
Six Ways a Curve Goes Off
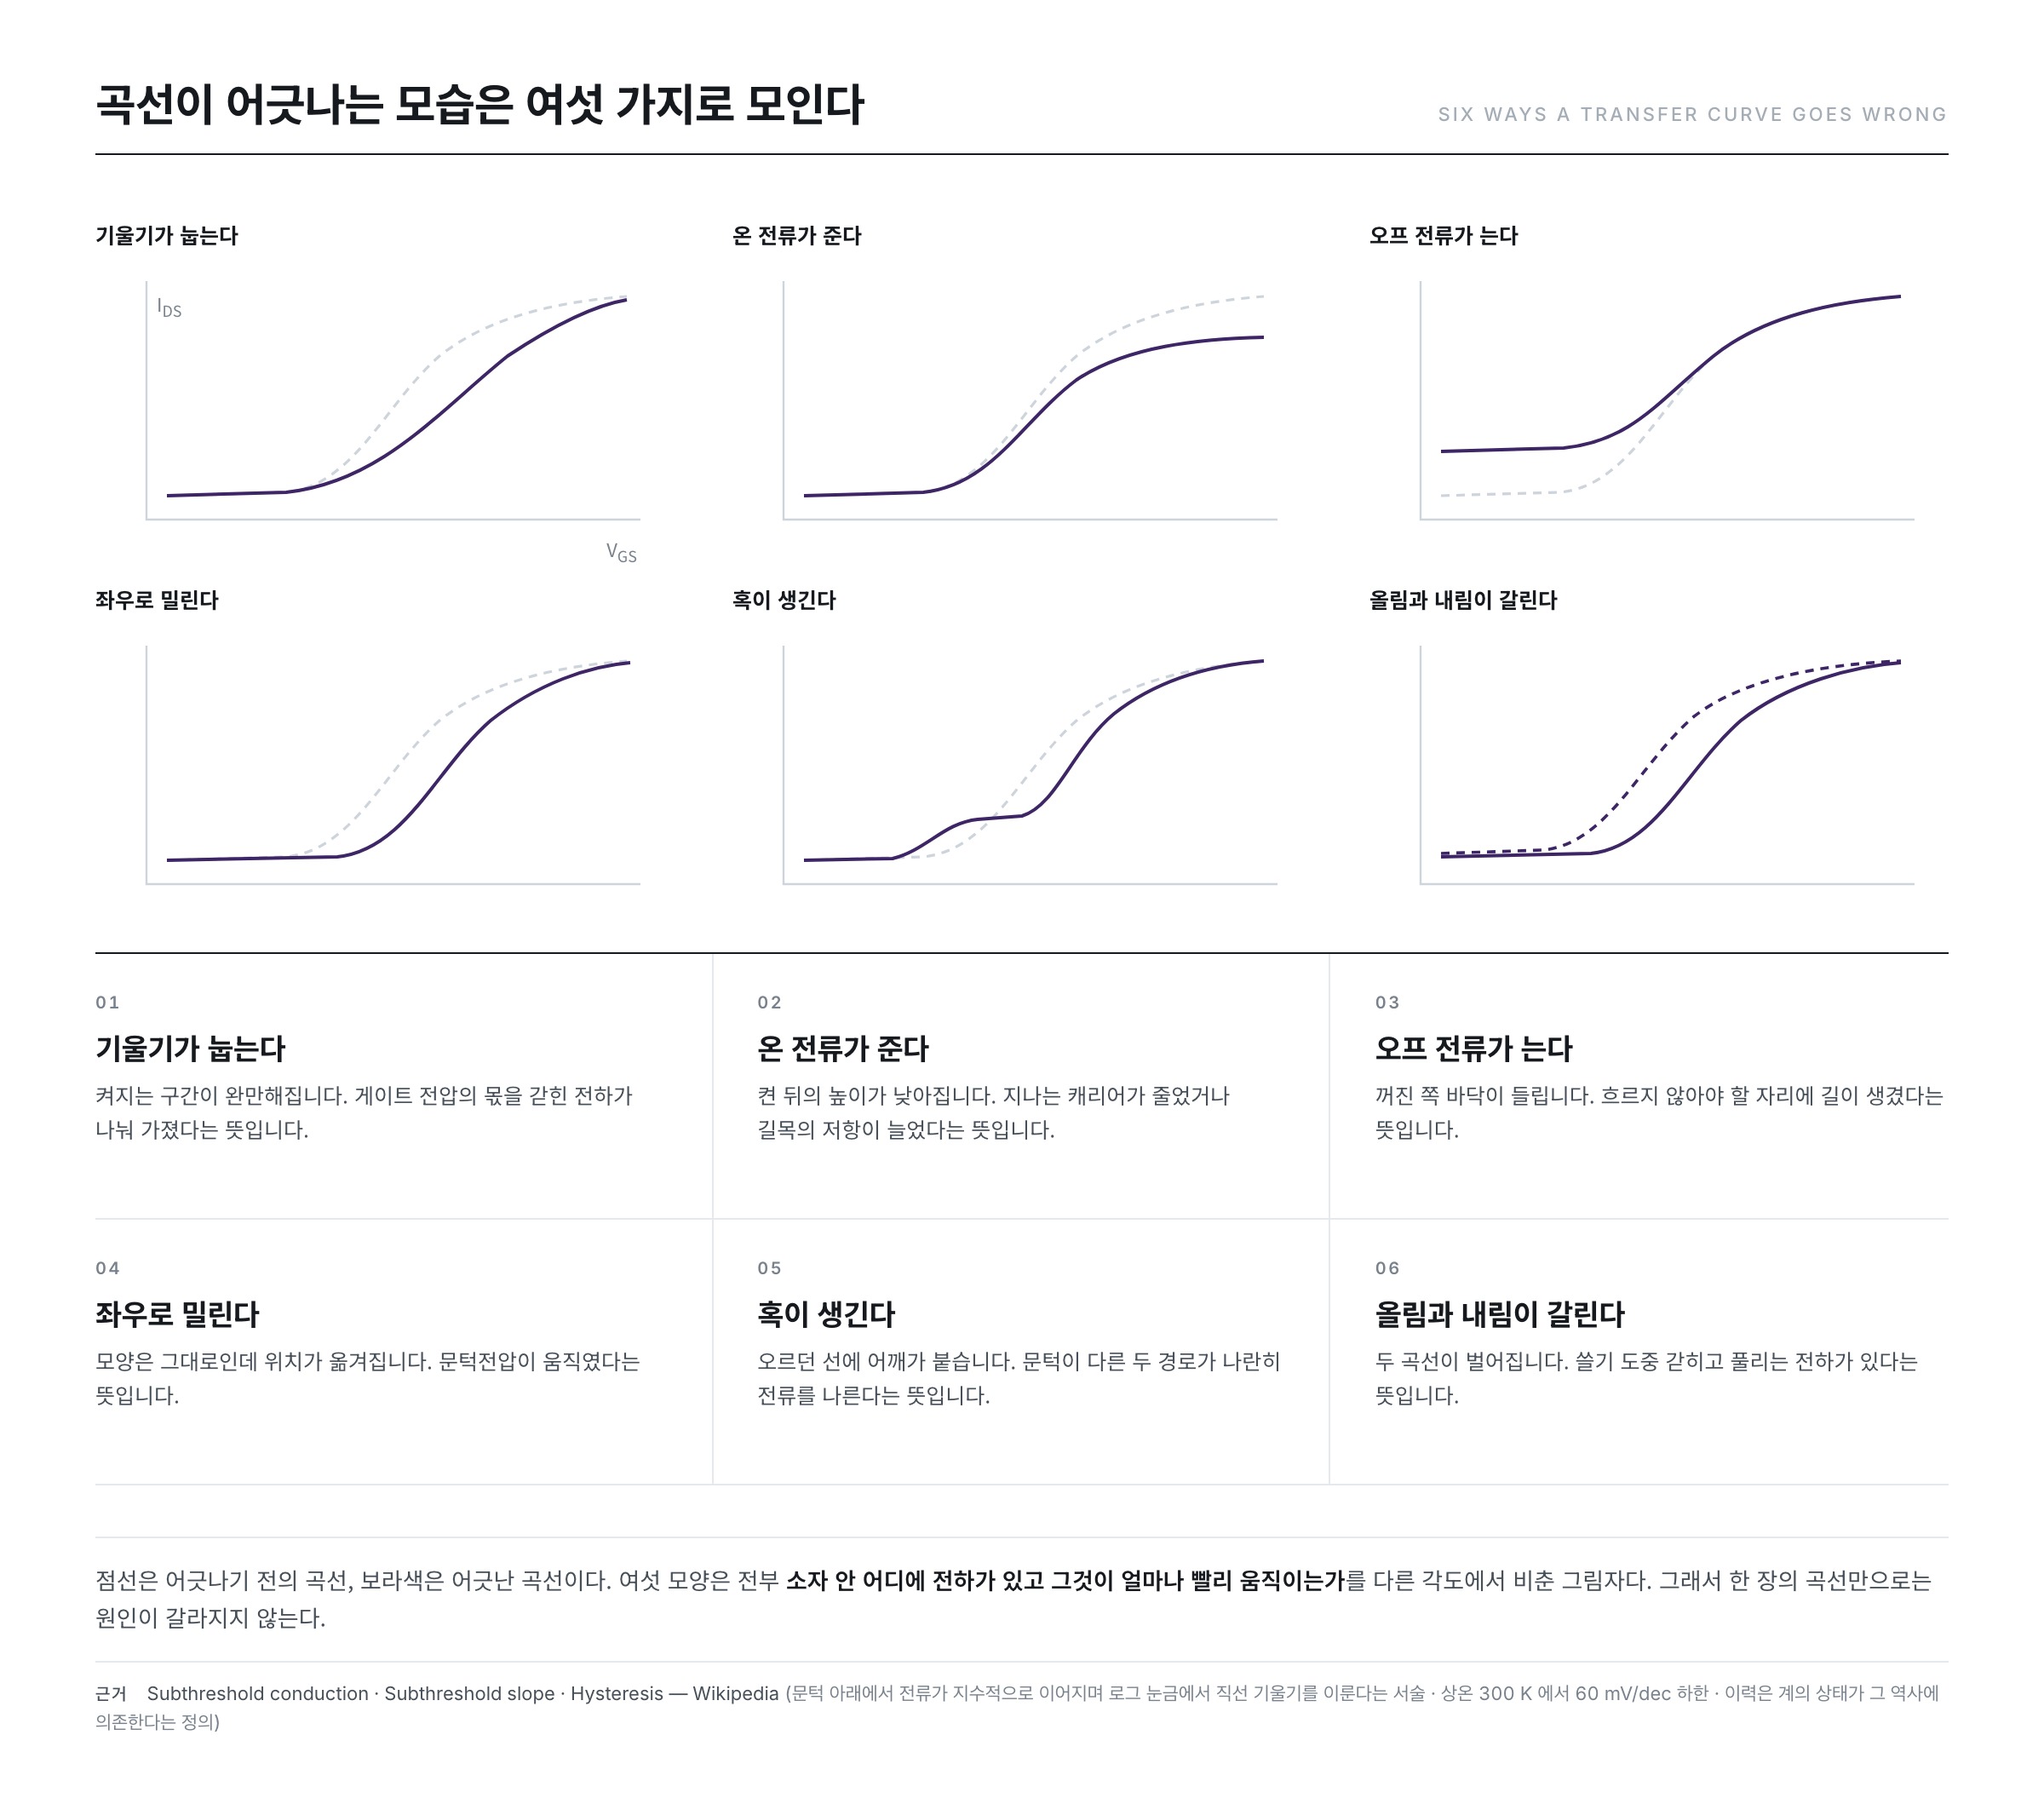
The Wikipedia article "Thin-film transistor" defines the thin-film transistor (TFT) as a field-effect transistor made by depositing thin films. The one picture that sums such a device up is the transfer curve — gate voltage on the horizontal axis, drain current on the vertical axis in logarithmic scale. The ways that curve goes off are not endless; they gather into six.
- The slope lies down — the turn-on region becomes gradual.
- The on-current drops — the height after turn-on is lower.
- The off-current rises — the floor on the off side lifts.
- The whole curve shifts sideways — the shape is intact, but the position has moved.
- A hump appears — a shoulder attaches itself to the rising line.
- Hysteresis appears — the line measured on the way up and the line measured on the way down split apart.
One — The Subthreshold Slope Lies Down
The Wikipedia article "Subthreshold conduction" states that even at gate voltages below the threshold the current does not become zero but continues exponentially with gate voltage. Drawn on a logarithmic scale an exponential becomes a straight line, and the "Subthreshold conduction" article calls the slope of that line the subthreshold slope.
It tells us how much gate voltage it takes to change the current tenfold, so its unit is mV/dec.
The Answer Is Inside the Equation
The Wikipedia article "Subthreshold slope" writes this value as follows.
S = ln(10) · (kT/q) · ( 1 + Cd / Cox )
Cd is the depletion-layer capacitance, Cox the gate insulator capacitance, and kT/q the thermal voltage. The "Subthreshold slope" article states that when the bracket approaches 1 the value becomes 60 mV/dec at room temperature (300 K). This is the lower bound.
Put into words, it goes like this. The voltage applied to the gate is divided in two. Part of it falls across the insulator, and the rest moves the potential at the semiconductor surface. Only the latter turns the channel on. The ratio inside the bracket expresses how much of the gate voltage leaks away elsewhere.
So a slope that lies down means one thing — something has taken a share of the gate voltage.
What Takes It Is Trapped Charge
The density of states (DOS, Density of States) seen in the fifth and eighth parts of the previous series carries over here. If there are places inside the bandgap where an electron can sit, some of the electrons the gate has drawn in settle into those places instead of flowing through the channel. Settled charge behaves electrically like a capacitance too, and takes its share of the gate voltage. The bracket grows, and the slope lies down.
Where such places come from is something the material tells us. The Wikipedia article "Amorphous silicon" states that some atoms in amorphous silicon carry a dangling bond, that this can cause anomalous electrical behavior, and that filling them with hydrogen reduces their density by several orders of magnitude.
The other end is shown by measurement. A study of amorphous IGZO transistors published on arXiv reports, at room temperature 300 K, an SS of 61 mV/dec together with an interface trap density below 1011 cm−2. A device sitting 1 mV from the lower bound of 60, and an interface with almost nowhere to catch charge, appear together.
That kT/q sits inside the equation can also be read exactly as it stands. As the temperature rises, the lower bound itself rises. The same device measured somewhere hotter shows a slope that lies down.
Two — The On-Current Drops
This is the case where the height after turn-on is lower. The linear-region current equation carried in the Wikipedia article "MOSFET" tells us where to look.
ID = μn Cox (W/L) [ (VGS − Vth) VDS − VDS2/2 ]
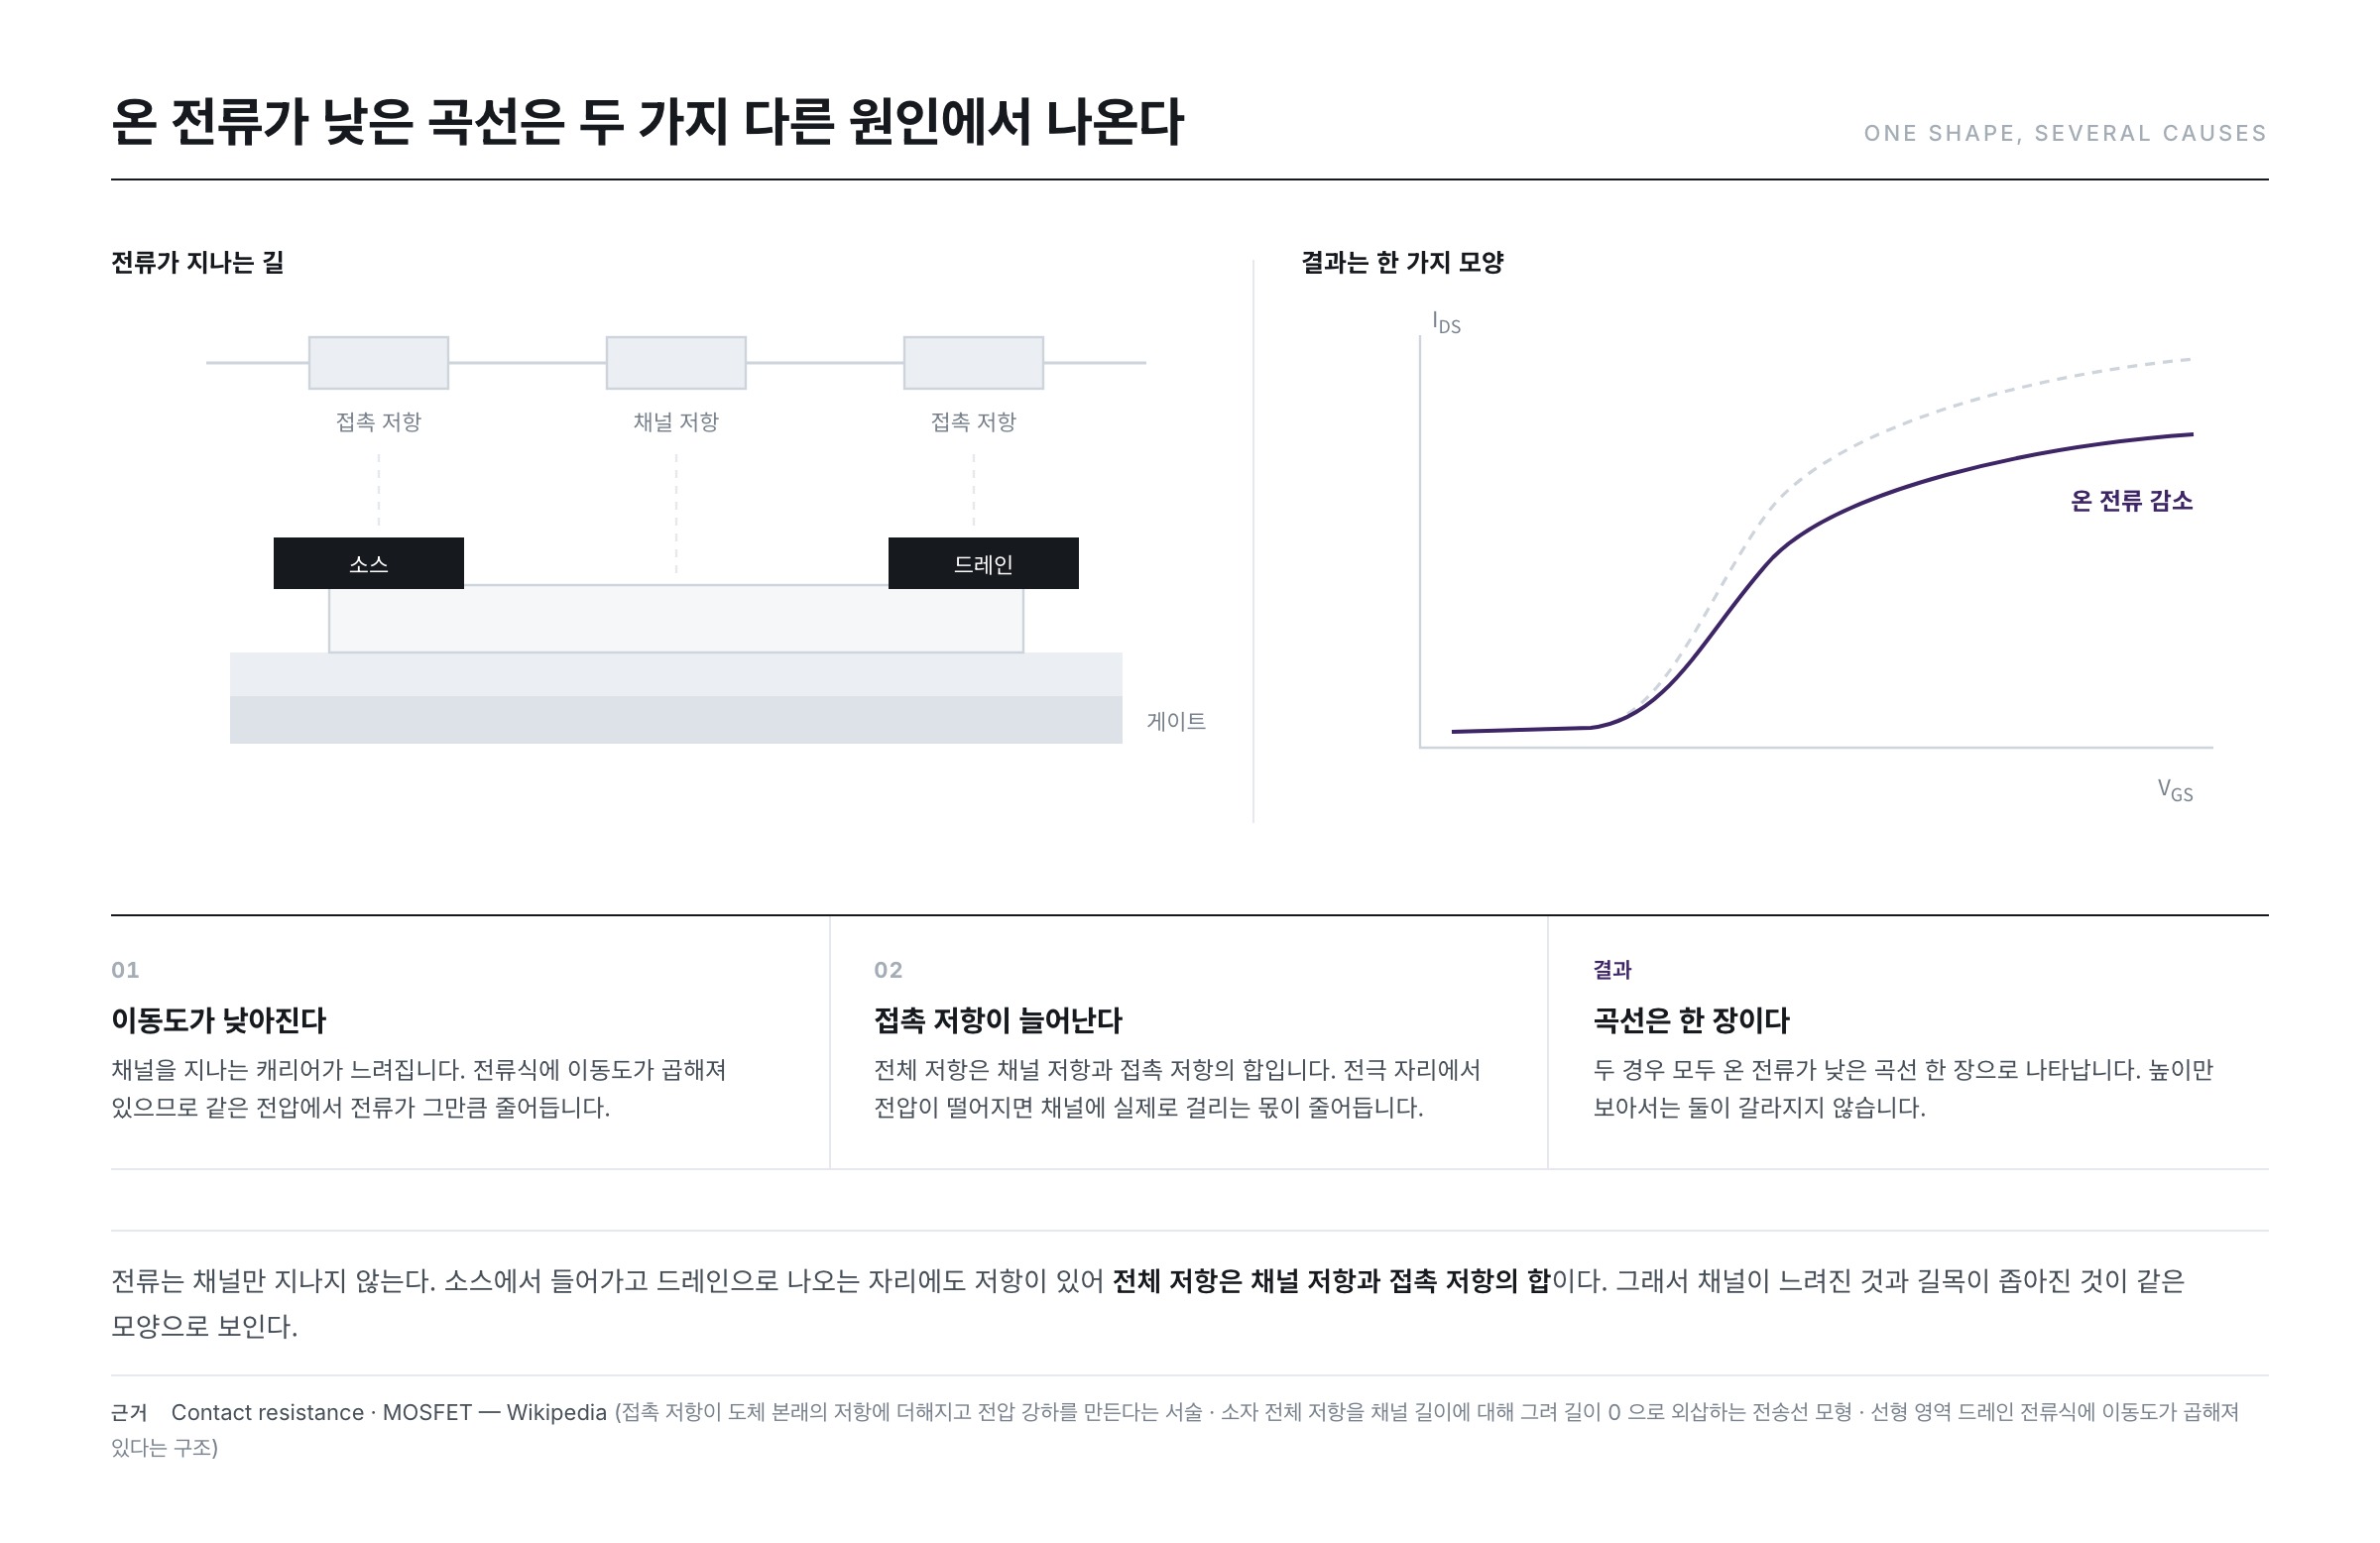
Mobility μ is multiplied in at the front. If the carriers slow down, the current at the same voltage falls by that much. Looking at a curve with a lowered on-current and reading it as mobility has gone down is natural.
But the Same Shape Also Comes Out of Resistance
The trouble is that the current does not pass through the channel alone. It enters the semiconductor from the source electrode, crosses the channel, and leaves through the drain electrode. There is resistance at the places where it goes in and comes out as well.
The Wikipedia article "Contact resistance" defines contact resistance as resistance that arises because the contacting surfaces do not meet perfectly, and because of films or oxide layers on those surfaces. The "Contact resistance" article states that this resistance adds to the conductor's own resistance and produces a considerable voltage drop in circuits carrying large current.
The measurement method shows this structure directly. The transmission line model (TLM, Transmission Line Model) introduced by the "Contact resistance" article extracts contact resistance by plotting the total device resistance against channel length and extrapolating to zero length. That means resistance remains even at zero length — in other words, total resistance = channel resistance + contact resistance.
When contact resistance grows, part of the applied voltage drops at that spot. The voltage actually across the channel falls, and so does the current. The result that appears is the same as when mobility has gone down — one curve with a low on-current.
Something that will recur throughout this series appears here for the first time. One shape corresponds to several causes. A low on-current by itself does not separate a channel that has slowed from a passage that has narrowed.
Three — The Off-Current Rises
This is the case where the floor lifts in the region that ought to be off. The Wikipedia article "Leakage (electronics)" defines leakage current as current that flows when ideally it should be zero. The definition is half the answer — it means a path has opened where nothing should flow. The "Leakage (electronics)" article lists several different paths side by side.
- Tunneling through the insulating layer — the "Leakage (electronics)" article states that leakage grows exponentially as the insulating region becomes thinner.
- Between source and drain — what the "Leakage (electronics)" article calls subthreshold conduction. The exponential tail seen earlier becomes the floor value itself.
- The reverse-biased junction — the "Leakage (electronics)" article notes that leakage in a reverse-biased diode is sensitive to temperature.
Dimensions come into it here. The Wikipedia article "Drain-induced barrier lowering" states that as the channel gets shorter the drain comes close enough to touch the channel the way the gate does, and that when it becomes very short the gate can no longer turn the device fully off. The floor lifts.
Light becomes a path too. The "Amorphous silicon" article seen earlier states that adding hydrogen greatly improves photoconductivity. That is to say, the property of making carriers out of light is built into the material. The Wikipedia article "Indium gallium zinc oxide" notes that IGZO transistors are slightly photosensitive, but that the effect becomes pronounced only above a photon energy of 3 eV, that is, in the deep violet to ultraviolet range.
One curve with a lifted floor holds, all at once, current that tunneled through the insulator, current left over along the channel, current that came across the junction, and current made by light. On a logarithmic scale their sum follows whichever is largest. So a single value does not separate which path has opened.
Four — The Whole Curve Shifts Sideways
This is the case where the shape is intact but the position has moved — that is, where the threshold voltage has moved.
Why it moves comes straight out of the definition of capacitance. The Wikipedia article "Capacitance" defines capacitance as C = q / V, the ratio of charge to potential difference. Turned around, it is V = q / C. If unwanted charge q sits on the gate insulator capacitance Cox, it is the same as having already applied q/Cox converted into gate voltage. The curve moves sideways by that much.
The direction of the push tells us the sign of the charge. A study on threshold voltage shift in amorphous IGZO thin-film transistors (DOI 10.3390/mi12030327) states that electrons trapped in the gate insulator cause a positive threshold voltage shift, and that holes trapped at the interface between the channel and the etch stop layer cause a negative threshold voltage shift.
If the curve has gone to the right, more voltage is needed to turn the device on, which means negative charge has built up and is cancelling the gate. If it has gone to the left, the reverse.
Here Too, One Shape Has Several Causes
The curve moves sideways even when no charge has built up. The "Drain-induced barrier lowering" article states that raising the drain voltage lowers the threshold voltage, and that in a short channel this appears as a simple parallel shift of the subthreshold curve. With nothing built up, changing a single measurement condition produces the same shape.
Five — A Hump Appears
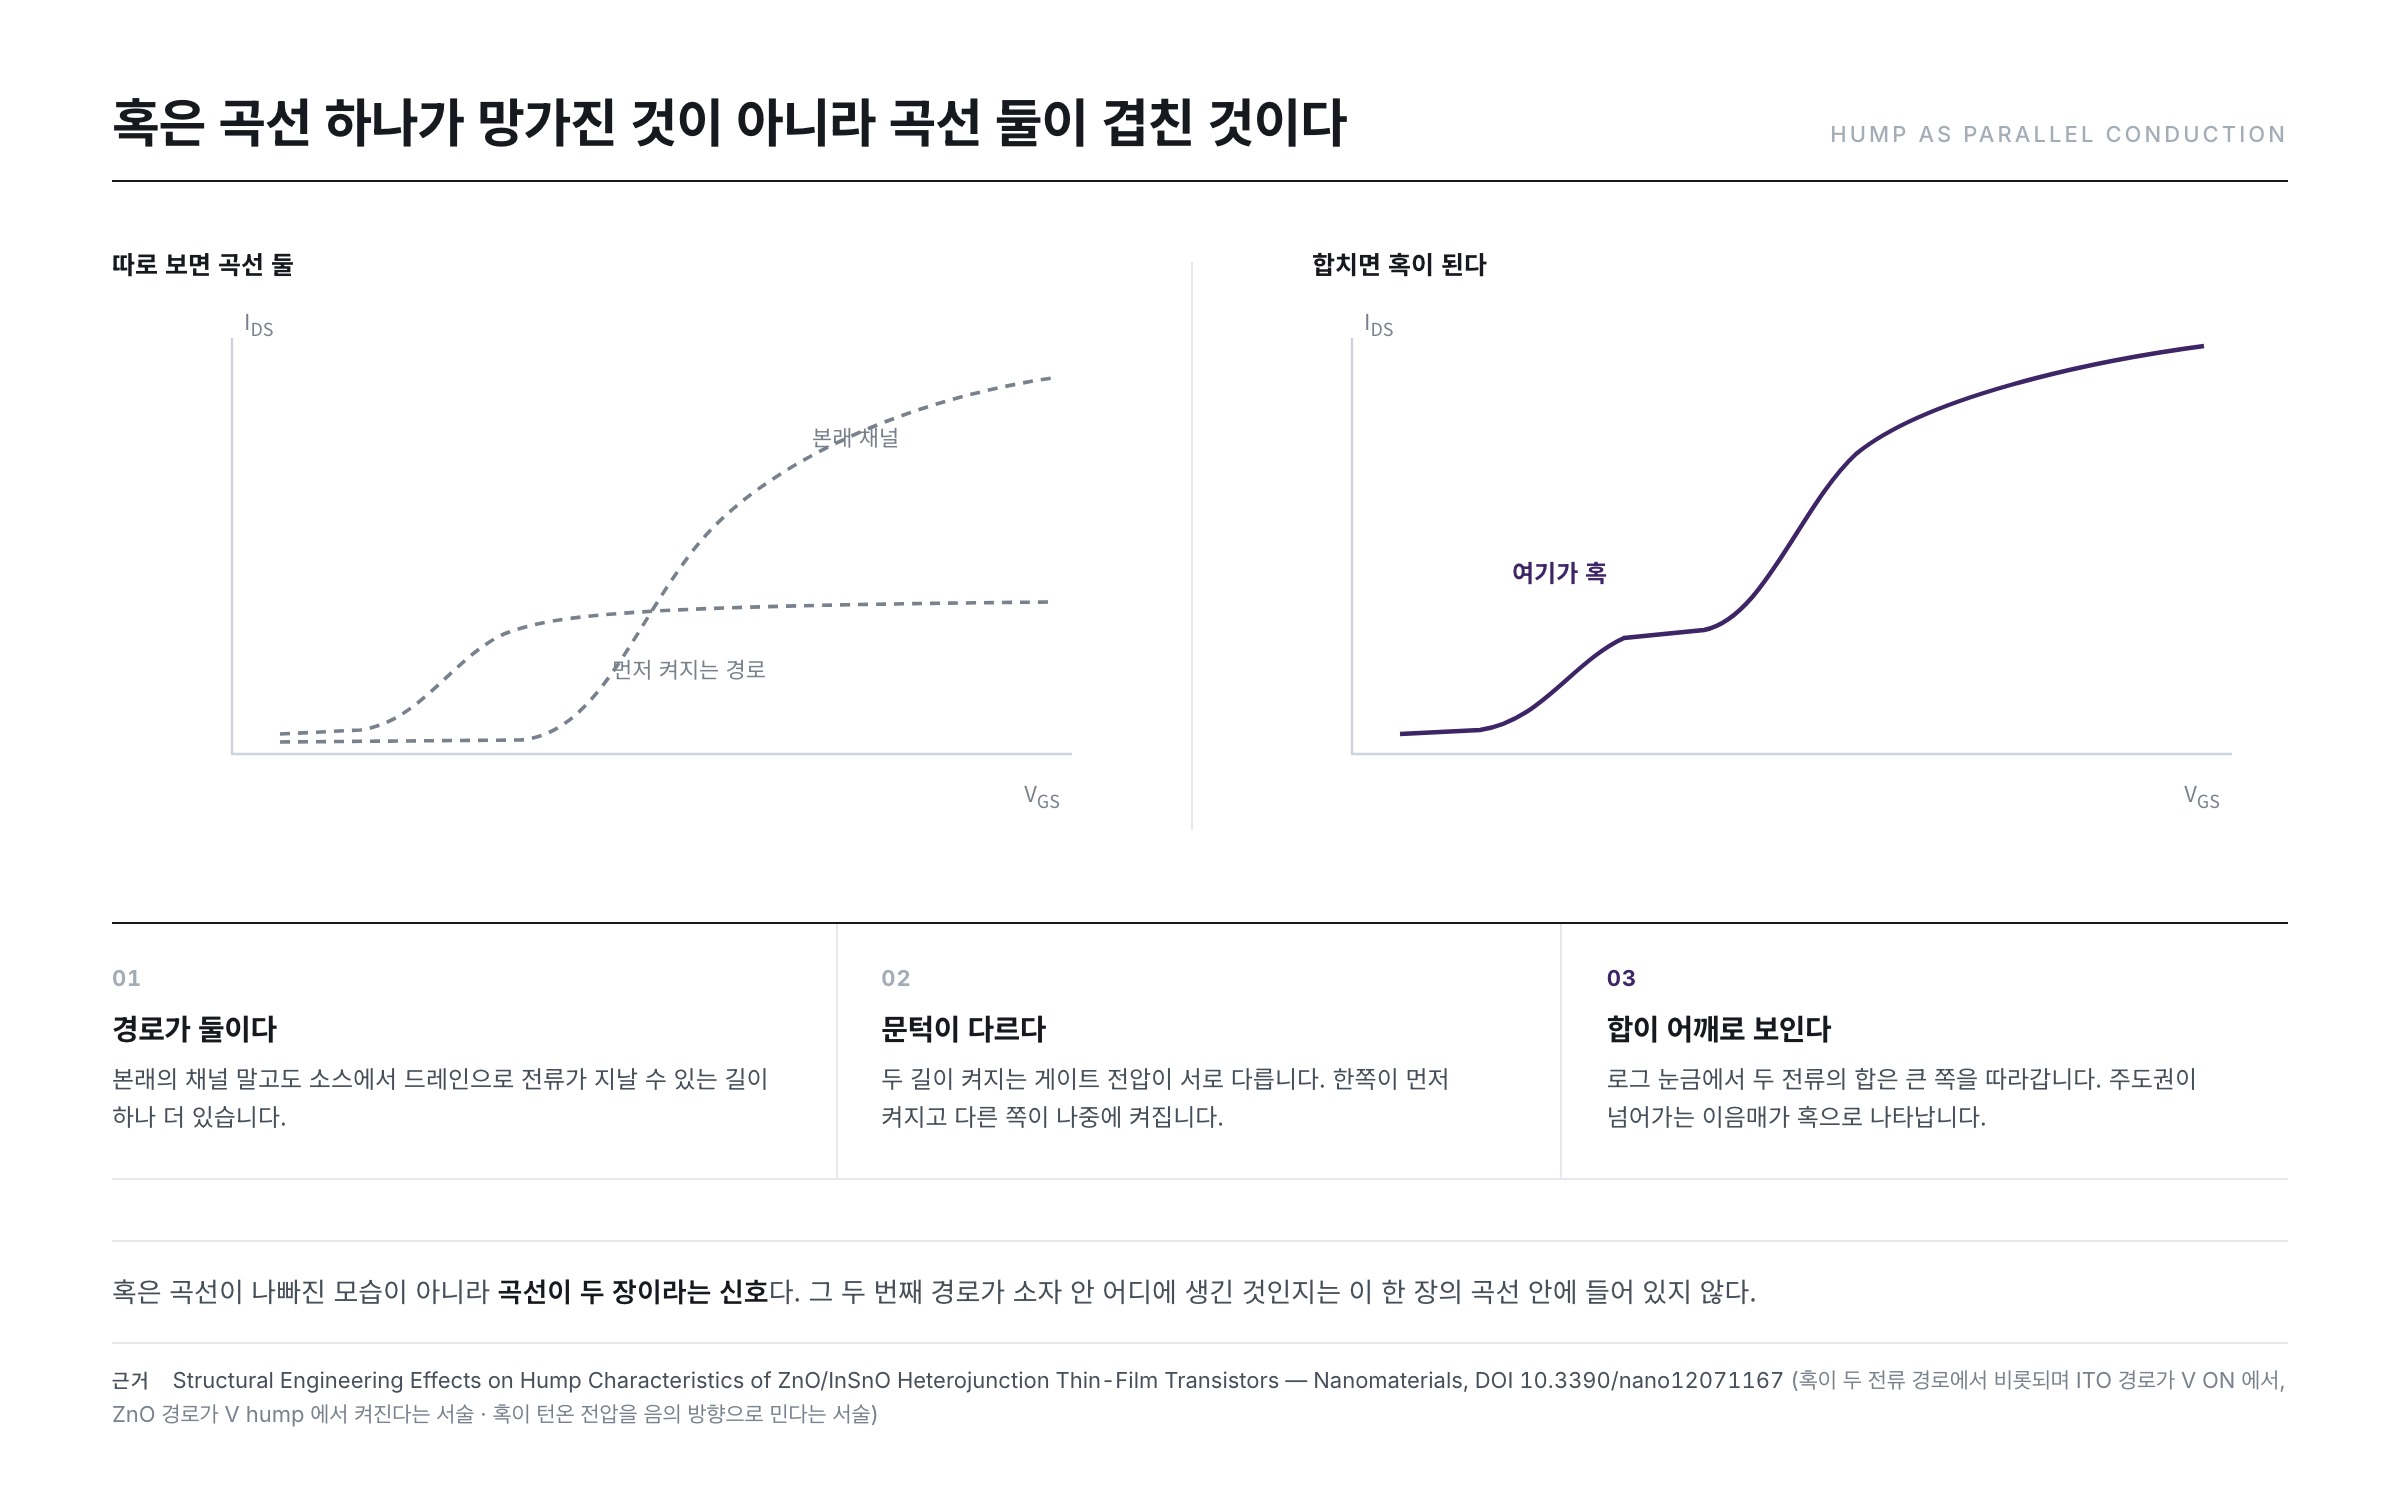
This is the case where a shoulder attaches itself to the rising line. This shape is different in character from the previous four — because it is a sign that there is not one curve.
A study on the hump characteristics of ZnO/ITO heterojunction thin-film transistors (DOI 10.3390/nano12071167) explains the phenomenon in terms of two current paths. The Nanomaterials paper states that the ITO current path turns on first at VON, while the ZnO current path turns on at Vhump. It also notes that the hump appearing in the transfer curve pushes the turn-on voltage of the device in the negative direction.
On a logarithmic scale the sum of two currents follows the larger one. At first the path that turned on earlier carries the whole thing, and from some point the original channel overtakes it. The seam where the lead passes over shows up as a shoulder. What was being seen as one picture was in fact two pictures laid on top of each other.
So what a hump says is not "something is bad somewhere" but "there is one more path, with a different threshold". Where that path formed is not contained in this one curve.
Six — The Way Up and the Way Down Split Apart
The last is hysteresis. The Wikipedia article "Hysteresis" defines hysteresis as the dependence of the state of a system on its history, and states that the result appears as a loop shape and that the value differs according to which direction the other variable is changed in.
In a transfer curve this takes a concrete form. A study on hysteresis in carbon nanotube thin-film transistors (DOI 10.3390/nano16140847) defines hysteresis as the difference between the threshold voltages determined respectively from the curve obtained while sweeping the gate voltage up from −20 V to 20 V and the curve obtained while sweeping it down from 20 V to −20 V.
The Nanomaterials paper gives the cause as well. It states that during the sweep the trapping and release of positive and negative charge occur together, and that this proceeds sequentially at the interface with the insulating layer, at the surface of the insulating layer, at bulk defects inside it, and deeper still.
What newly enters here is time. The previous five were stories read within a single curve, but hysteresis becomes visible only when two are laid on top of each other. When the time it takes to trap and release is close to the time the sweep takes, the act of measuring itself changes the state of the device.
The One Thing Running Through All Six
The six shapes look unrelated to one another. Yet all of them are asking the same two questions — where inside the device the charge is, and how fast that charge moves.
- Slope — who takes a share of the gate voltage.
- Height — how many carriers there are and how fast they are, and what stands in the passage.
- Floor — whether a path has opened where it should be blocked.
- Position — what has built up and how much, and what its sign is.
- Hump — how many paths there are.
- Hysteresis — how quickly that charge responds.
They are shadows of the same object cast from six directions. Just as an object cannot be reconstructed from one shadow, a single curve does not separate the causes. It is exactly as we saw twice in this part — a low on-current comes out of lowered mobility and out of contact resistance alike, and a shifted curve comes out of trapped charge and out of drain voltage alike.
So the method that remains is only to change the conditions and lay several curves on top of one another. Change the temperature and only the term containing kT/q moves; change the drain voltage and only the short-channel effect moves; put light in and take it away and only the current made by photoconduction moves; change the sweep rate and only the slowly trapped charge moves. Which shape moves under which condition — that is what narrows the cause down.
The remaining seven parts of this series are those conditions.
Summary
- The ways a transfer curve goes off gather into six — the slope lies down, the height drops, the floor lifts, the whole thing shifts, a hump appears, and the up-sweep and the down-sweep split apart.
- The subthreshold slope is S = ln(10)·(kT/q)·(1 + Cd/Cox), with a room-temperature lower bound of 60 mV/dec. A slope that lies down means something else has taken a share of the gate voltage.
- Current does not pass through the channel alone. Because total resistance = channel resistance + contact resistance, lowered mobility and increased contact resistance look like the same shape on the curve.
- A hump is not a signal of something wrong but a signal that there are two curves. It means two paths with different thresholds are carrying current side by side.
- All six shapes illuminate the position and the speed of charge from different angles. One curve does not separate the causes; several have to be laid on top of one another with the conditions changed.
The next part goes into the first of these six. We will see how the density of trapped charge is read out of the subthreshold slope alone, and what that value tells us and what it does not.
References
- Thin-film transistor — Wikipedia : the definition of a TFT
- Subthreshold conduction — Wikipedia : the statement that current continues exponentially below the threshold and forms a straight-line slope on a logarithmic scale
- Subthreshold slope — Wikipedia : the equation S = ln(10)(kT/q)(1 + Cd/Cox) and each of its terms, and the 60 mV/dec lower bound at room temperature 300 K
- Subthreshold Swing Behavior in Amorphous IGZO Transistors — arXiv:2506.15238 : an SS of 61 mV/dec at room temperature 300 K and an interface trap density below 1011 cm−2
- Amorphous silicon — Wikipedia : the statement that dangling bonds cause anomalous electrical behavior, and the statement that hydrogen lowers their density by several orders of magnitude and greatly improves photoconductivity
- MOSFET — Wikipedia : the linear-region drain current equation and the structure in which mobility is multiplied into it
- Contact resistance — Wikipedia : the definition of contact resistance, the statement that it adds to the intrinsic resistance and produces a voltage drop, and the transmission line model
- Leakage (electronics) — Wikipedia : the definition of leakage, the statement that tunneling increases exponentially as the insulating layer thins, subthreshold conduction, and the temperature sensitivity of reverse leakage
- Drain-induced barrier lowering — Wikipedia : the definition that a high drain voltage lowers the threshold voltage, the parallel shift of the subthreshold curve, and the statement that a very short channel cannot be turned off
- Capacitance — Wikipedia : the definition of capacitance, C = q/V
- Threshold Voltage Shift under Positive Bias Stress in Bottom-Gate a-InGaZnO TFTs, Micromachines (DOI 10.3390/mi12030327) : the statement that trapped electrons cause a positive and trapped holes a negative threshold voltage shift
- Structural Engineering Effects on Hump Characteristics of ZnO/InSnO Heterojunction TFTs, Nanomaterials (DOI 10.3390/nano12071167) : the statement that the hump originates from two current paths, with the ITO path turning on at VON and the ZnO path at Vhump
- Hysteresis-Induced Performance Variations and Interfacial Charge Trapping in Carbon Nanotube TFTs, Nanomaterials (DOI 10.3390/nano16140847) : the statement defining hysteresis as the threshold voltage difference between the up- and down-sweeps, and the statement that charge trapping and release proceed sequentially at the interface, the insulating layer, and bulk defects
- ※ The portions quoted from Wikipedia articles in the list above are licensed under CC BY-SA 4.0.