The six installments up to here were all about measuring current. The output curve swept in drain voltage and the transfer curve swept in gate voltage alike had the drain current on the vertical axis every time.
But for current to flow, a channel has to be there already. A current curve is, in that sense, the story of after the channel has been made. What is pushed away and what gathers just under the insulator while the gate voltage is being raised is hard to catch, because that is the region where almost no current flows.
This installment changes the quantity being measured. To capacitance. The process of the channel being made only becomes visible when it is watched through capacitance.
The condition values in the text are examples meant to show how the calculation goes, not the specifications of any particular company. Every figure quoted was checked in the open literature, and the sources are left at the end of the article.
What is being measured
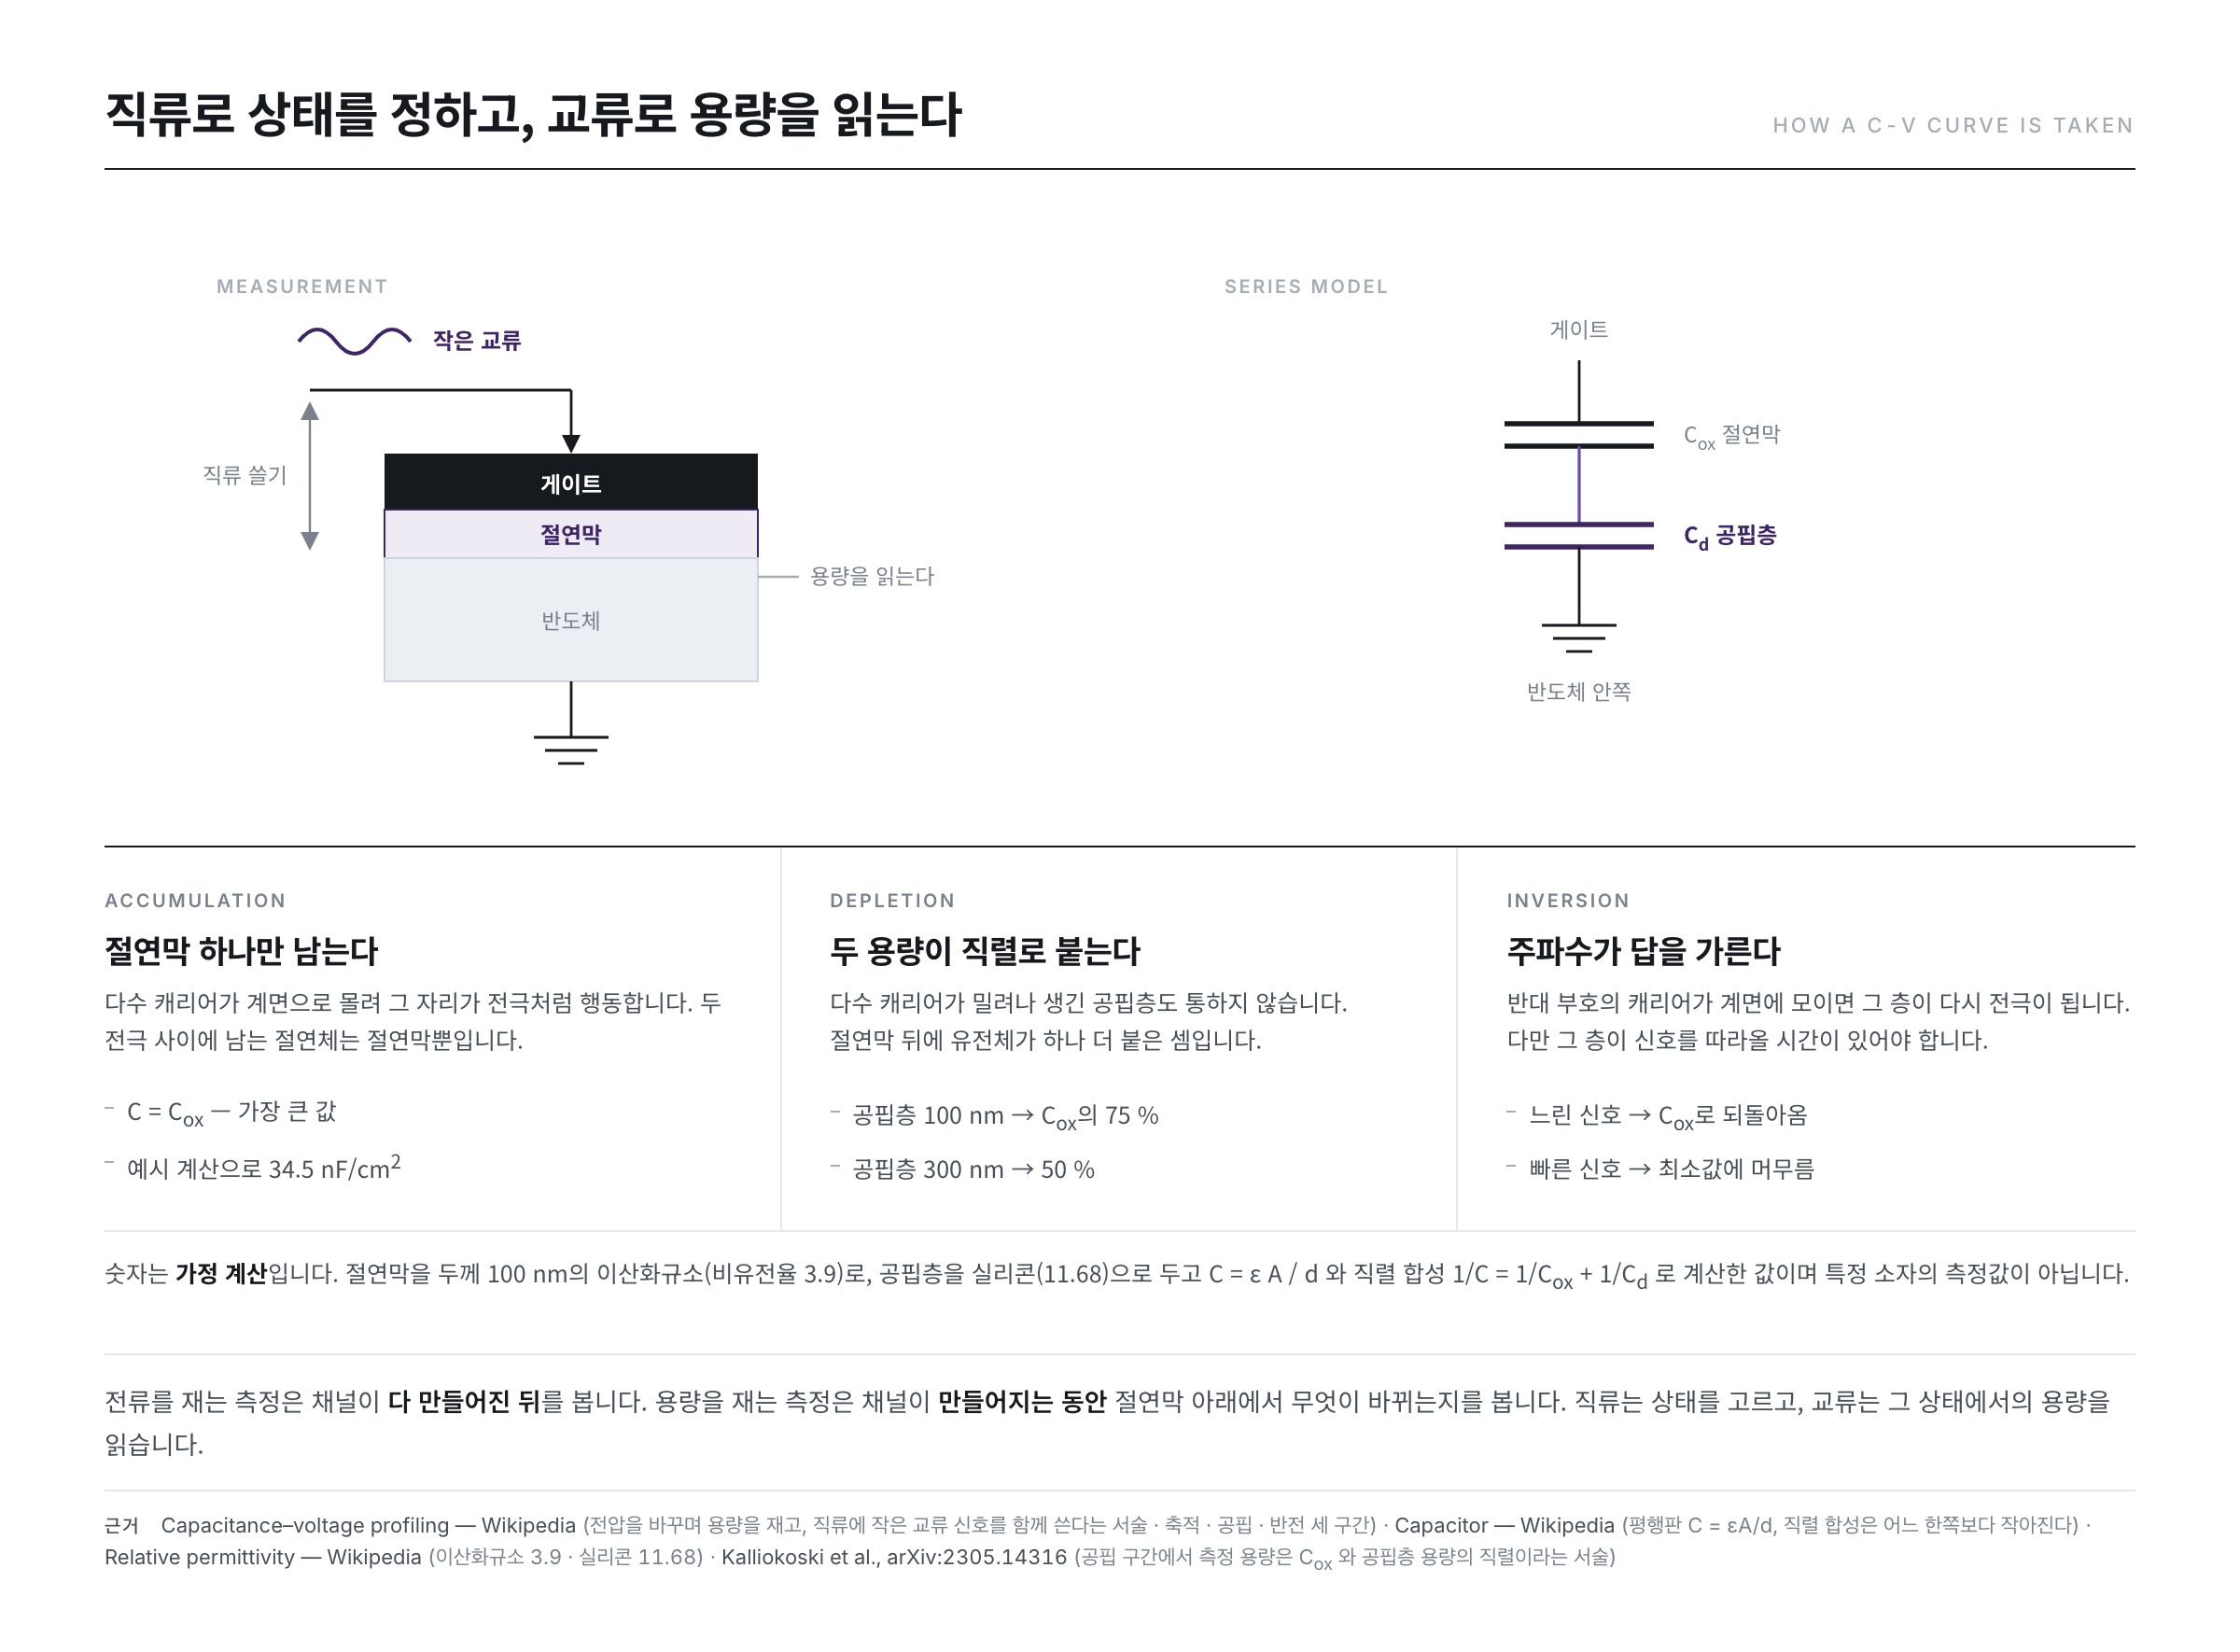
The English Wikipedia "Capacitance–voltage profiling" article defines this measurement as follows — the capacitance is measured while the applied voltage is varied, and plotted as a function of that voltage. The "Capacitance–voltage profiling" article writes that the measurement is made with direct current alone, or with direct current together with an alternating current of small signal amplitude.
The two signals have different roles. The DC gate voltage fixes which state the semiconductor surface is put in, and the small AC riding on top of it makes the voltage tremble by just enough not to disturb that state, so as to read out the capacitance in that state.
The reason this can be measured lies in the structure. The "MOSFET" article, speaking of the metal–oxide–semiconductor structure, states that since silicon dioxide is a dielectric, the structure is the same as a planar capacitor with one of the electrodes replaced by a semiconductor. Underneath the gate there is already a capacitor.
Three regions — why the capacitance takes the value it does
All that is needed are two expressions. The parallel-plate capacitance from the "Capacitor" article
C = ε A / d
and the series combination, also from the "Capacitor" article.
Ceq = ( 1/C1 + 1/C2 + … )−1
The "Capacitor" article writes that connecting capacitors in series adds the separations between the plates and makes the whole a capacitor smaller than any one of them. That single sentence explains almost the entire shape of the C-V curve.
The calculations below are all assumptions. The insulator is taken as silicon dioxide 100 nm thick, the semiconductor as silicon, and the gate as 100 μm on a side. The relative permittivities come from the table in the "Relative permittivity" article — silicon dioxide 3.9 and silicon 11.68 — and the vacuum permittivity from the "Vacuum permittivity" article, about 8.854 × 10⁻¹² F/m.
Accumulation — only the insulator is left
Apply a voltage of the sign that draws the majority carriers towards the interface and they crowd densely just below it. That is accumulation.
A paper on C-V measurement of MOS capacitors, arXiv:2305.14316, describes this region as follows — in the voltage range where the capacitance ratio C/Cox is 1, majority carriers are drawn to the silicon–oxide interface and form an accumulation layer at zero surface potential. A layer dense with carriers conducts, so it acts as an electrode. The only insulator left between the two electrodes is the insulating film alone.
The capacitance is then exactly the parallel-plate expression.
Cox = 3.9 × 8.854 × 10−12 × 10−8 ÷ 10−7 ≈ 3.45 × 10⁻¹² F
About 3.45 pF. Divided by the area it is about 34.5 nF/cm2, and the highest flat part of the C-V curve is this value.
Depletion — two capacitances join in series
Move the voltage the other way and the majority carriers are pushed out. What remains is only immobile ions, so that layer does not conduct either. It is the depletion layer.
arXiv:2305.14316 describes the measured capacitance in this region as Cox in series with the depletion layer capacitance, and states that since the effective thickness of the depletion layer acting as the dielectric grows, the measured capacitance keeps decreasing with the gate voltage.
Let us put numbers in. If the depletion layer has grown to 100 nm,
- depletion layer capacitance Cd ≈ 103.4 nF/cm2 — the permittivity of silicon is three times as large, so it is three times as much for the very same thickness.
- series combination → 25.9 nF/cm2. It has come down to 75 % of the accumulation value.
If the depletion layer grows to 300 nm, Cd becomes nearly equal to Cox and the series combination becomes exactly half. Here it shows what the material is doing. Because the permittivity of silicon is three times that of the insulator, the depletion layer has to reach three times the insulator's thickness just to halve the capacitance.
This ratio has appeared once before. The "MOSFET" article writes the slope factor of the subthreshold region as n = 1 + Cdep/Cox. The quantity that fixed the slope of the current curve and the quantity that fixes how deep the capacitance curve goes down are the same ratio. Only the quantity being measured differed; what was being looked at was one thing.
Inversion — a layer of the opposite sign appears
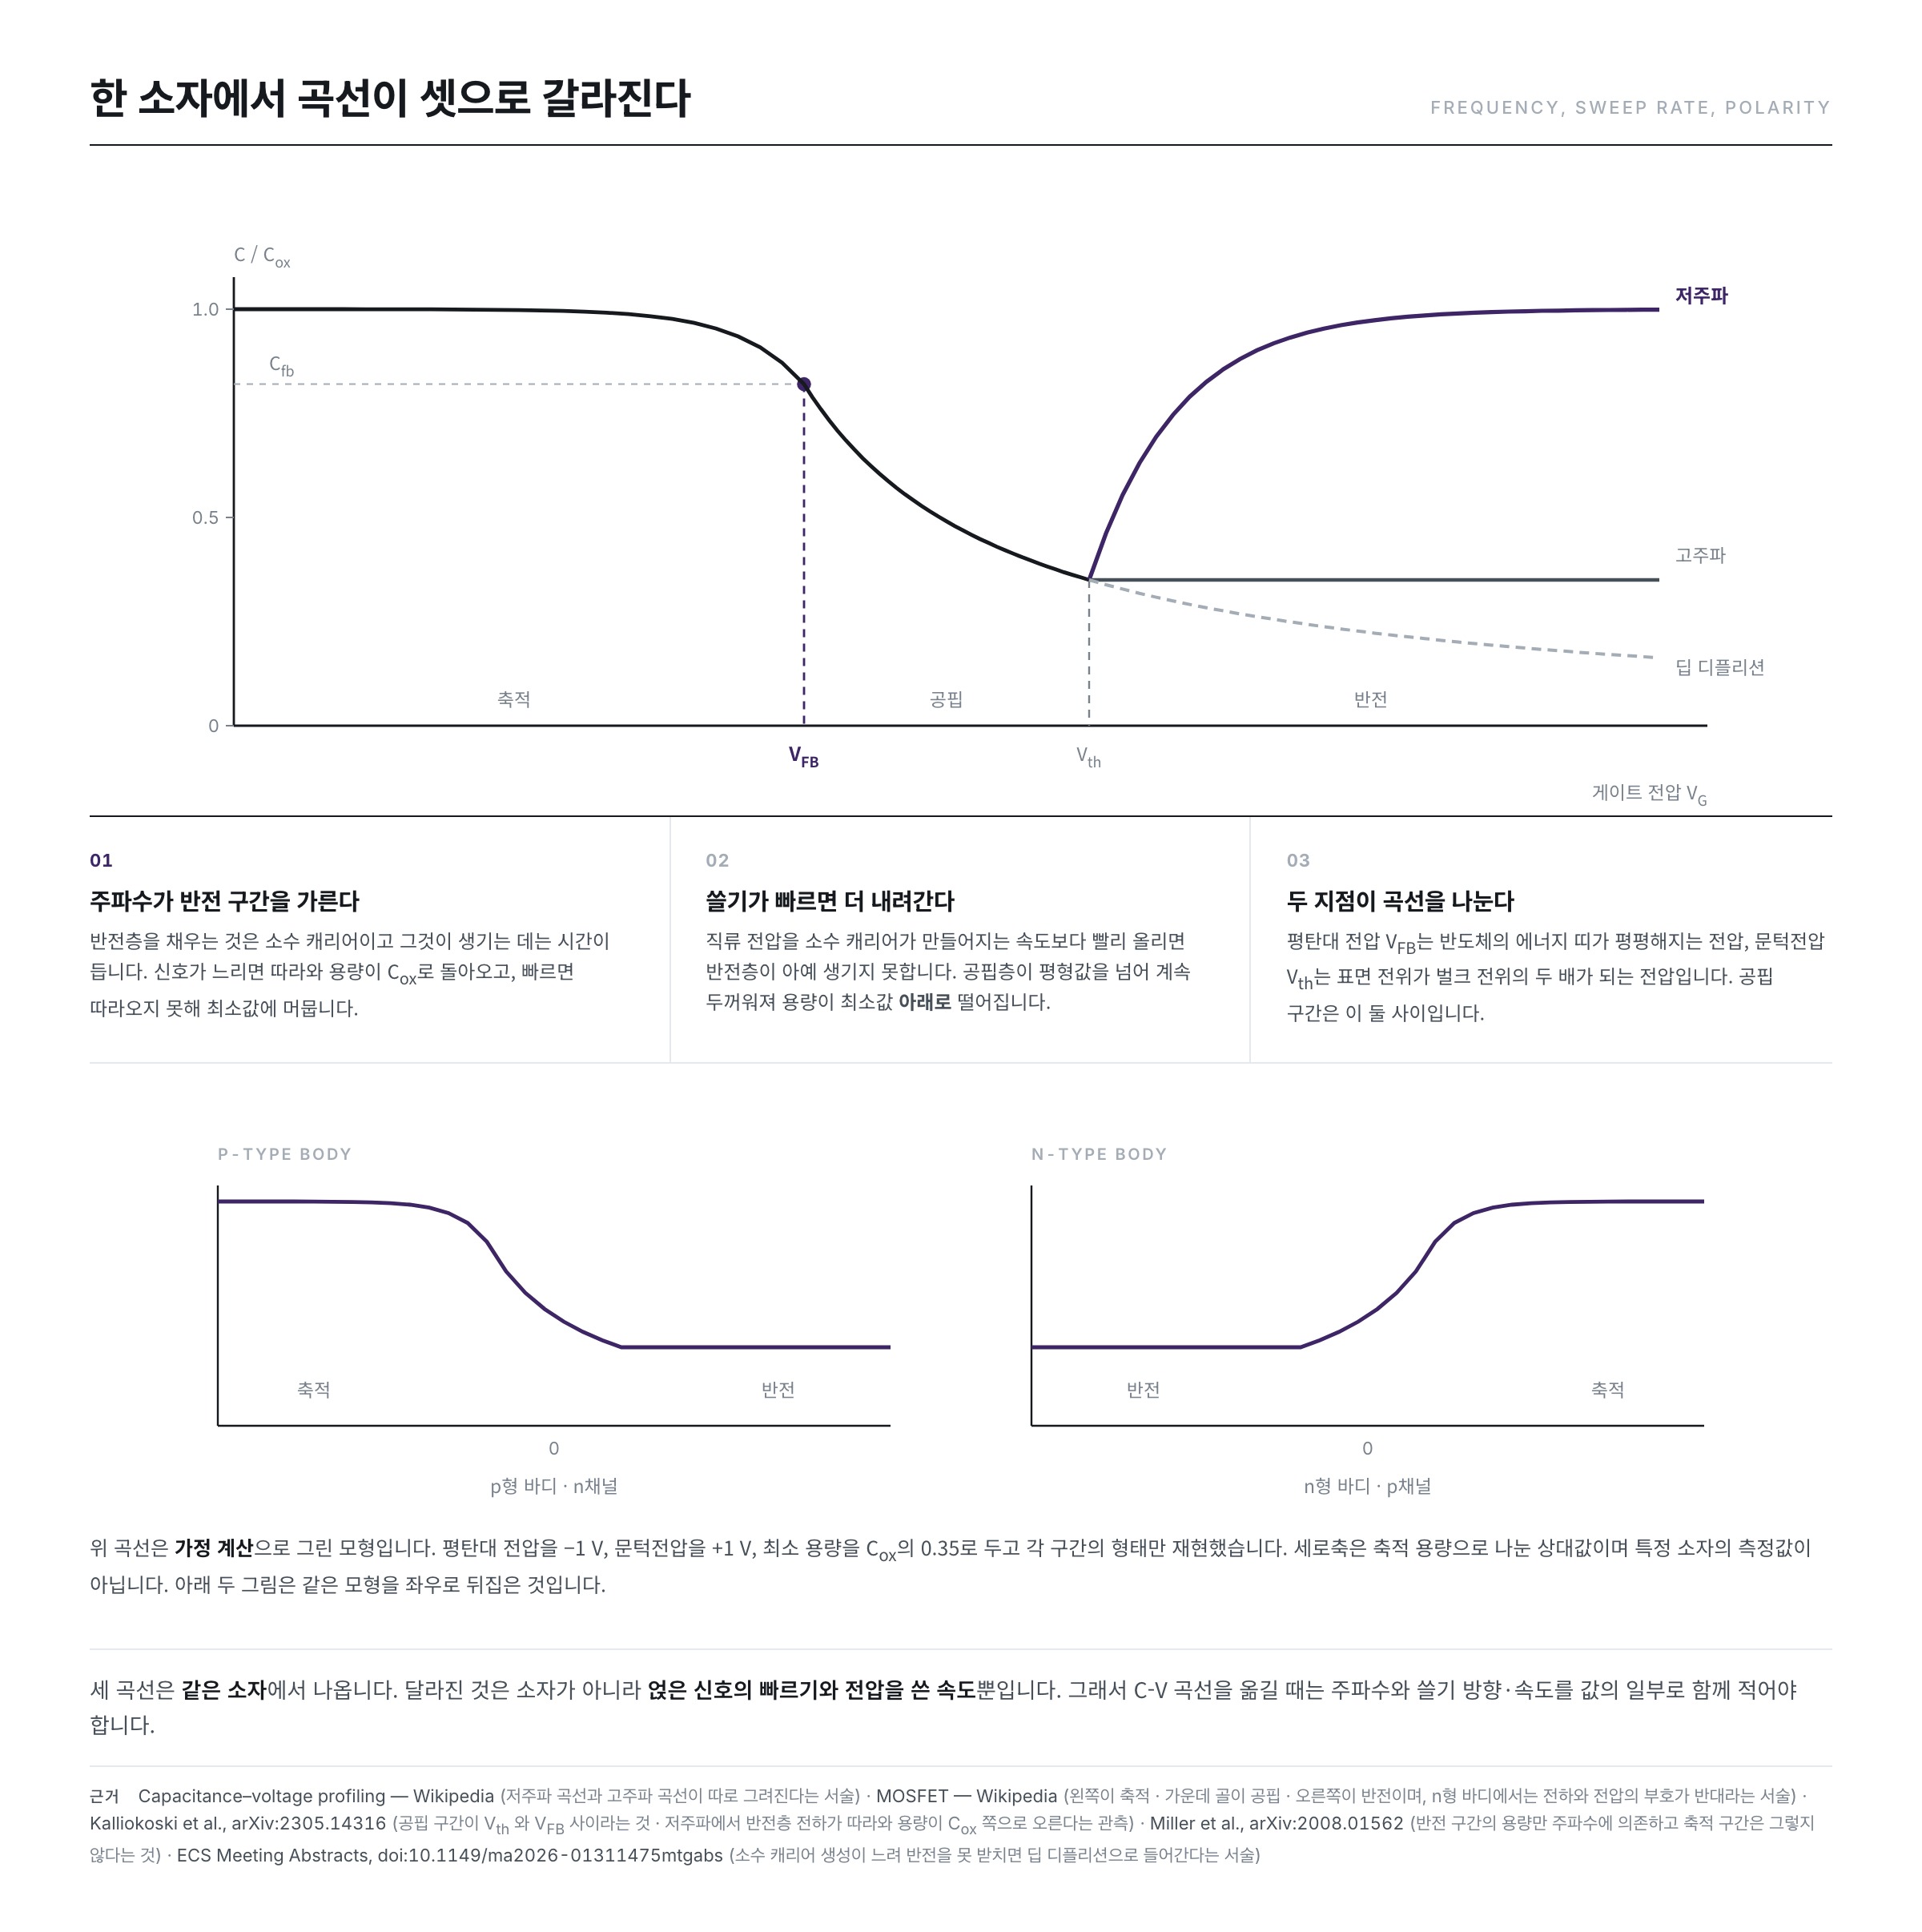
Raise the voltage further and the energy bands near the interface bend enough that this time the minority carriers gather at the surface and form a thin layer. The "MOSFET" article calls this layer the inversion layer and states that it is the channel itself. The "Capacitance–voltage profiling" article writes that in this region the capacitance rises again.
arXiv:2305.14316 also pins down the floor in between — when most of the available minority carriers have been drawn to the interface and formed the inversion layer, the depletion depth is at its maximum and the measured capacitance is at its minimum value Cmin.
Frequency — whether the minority carriers keep up
Whether the capacitance really does rise in the inversion region depends on how fast the alternating signal laid on top is.
A paper measuring the capacitance of a semiconductor island with a scanning probe, arXiv:2008.01562, states this property plainly — the capacitance of a metal–insulator–semiconductor structure shows frequency dependence in the inversion region, and does not in the accumulation region. The reason is given along with it. The response falls off as the pulse frequency is raised because the lifetime and generation time of the minority carriers that make up the inversion layer are finite, and in that specimen those times were on the scale of tens of microseconds.
So the path splits in two.
- A slow signal — the charge of the inversion layer goes in and out in step with the signal. arXiv:2305.14316 describes this case as one in which the inversion layer charge is supplied and removed fast enough to follow the change in gate voltage, so the depletion depth shrinks and the capacitance in the inversion region rises towards Cox. Since the inversion layer serves as an electrode, only the insulating film is left once again.
- A fast signal — the minority carriers cannot be generated at that speed. The inversion layer stays put just as the DC voltage made it, and all that responds to the alternating signal is the edge of the depletion layer. So the series combination is kept as it is and the capacitance stays at its minimum value.
That the accumulation region has no such split is the other face of the same story. What fills the accumulation layer is the majority carriers that were already inside, so there is no need to generate anything new.
Sweep rate — deep depletion
If the speed of the alternating signal matters, then the rate at which the DC voltage is swept matters too. The minority carriers that fill the inversion layer take time to be generated on this side as well.
A conference abstract on n-type silicon MOS capacitors, doi:10.1149/ma2026-01311475mtgabs, writes as follows — in n-type silicon the generation rate of holes, the minority carriers, is very slow, so inversion is hard to sustain under a fast or high-frequency bias, and the device either stays in depletion or enters the deep depletion region where minority carrier generation sets the limit. The doi:10.1149/ma2026-01311475mtgabs abstract records that at 1 MHz hole generation was too slow and strong deep depletion appeared, and that the high-frequency response went straight into deep depletion.
Why the capacitance goes below the minimum value is answered by the two expressions above. If no inversion layer can form, the only place that can take on the charge summoned by the gate is the depletion layer. So the depletion layer keeps getting thicker, past the maximum thickness of the equilibrium state. The doi:10.1149/ma2026-01311475mtgabs abstract writes the depletion width as W = √( 2 εSi ψs / q ND ), showing that it widens as the surface potential grows. In C = ε A / d, d grows, so C shrinks.
This state is not equilibrium but a passing state, and so it is sometimes created on purpose and measured. MOS Deep depletion C-V measurements using linear ramp voltages, presented at the International Electron Devices Meeting in 1969, treats exactly what its title says — measuring deep depletion C-V with linear ramp voltages.
NMOS and PMOS are mirrored left to right
The "MOSFET" article, speaking of the C-V curve of a bulk MOSFET, writes that the far left is accumulation, the valley in the middle is depletion, and the right is inversion. That is the story of an n-channel device with a p-type body. A positive gate voltage pushes the holes away to make a depletion layer, and raising it further gathers electrons into an inversion layer, so accumulation sits on the opposite side, at negative voltage.
What about an n-type body? The "MOSFET" article states that a negative gate voltage creates a p channel at the surface of the n-type region, and that this is the same as the n-channel case except that the signs of the charge and voltage are reversed. arXiv:2305.14316 likewise writes that in its n-type specimen the inversion layer formed at negative gate voltage.
So the C-V curves of the two devices are the same picture with only the sign of the horizontal axis flipped. Only which side accumulation comes on changes; how it is read — the high side is the insulator capacitance, the valley is depletion, and beyond it is inversion — is the same.
Values read off the curve
The "Capacitance–voltage profiling" article lists what this measurement yields — oxide thickness, oxide charge, mobile ion contamination, interface trap density, and also average doping concentration, doping profile, and carrier lifetime. Let us look at how the first three come out.
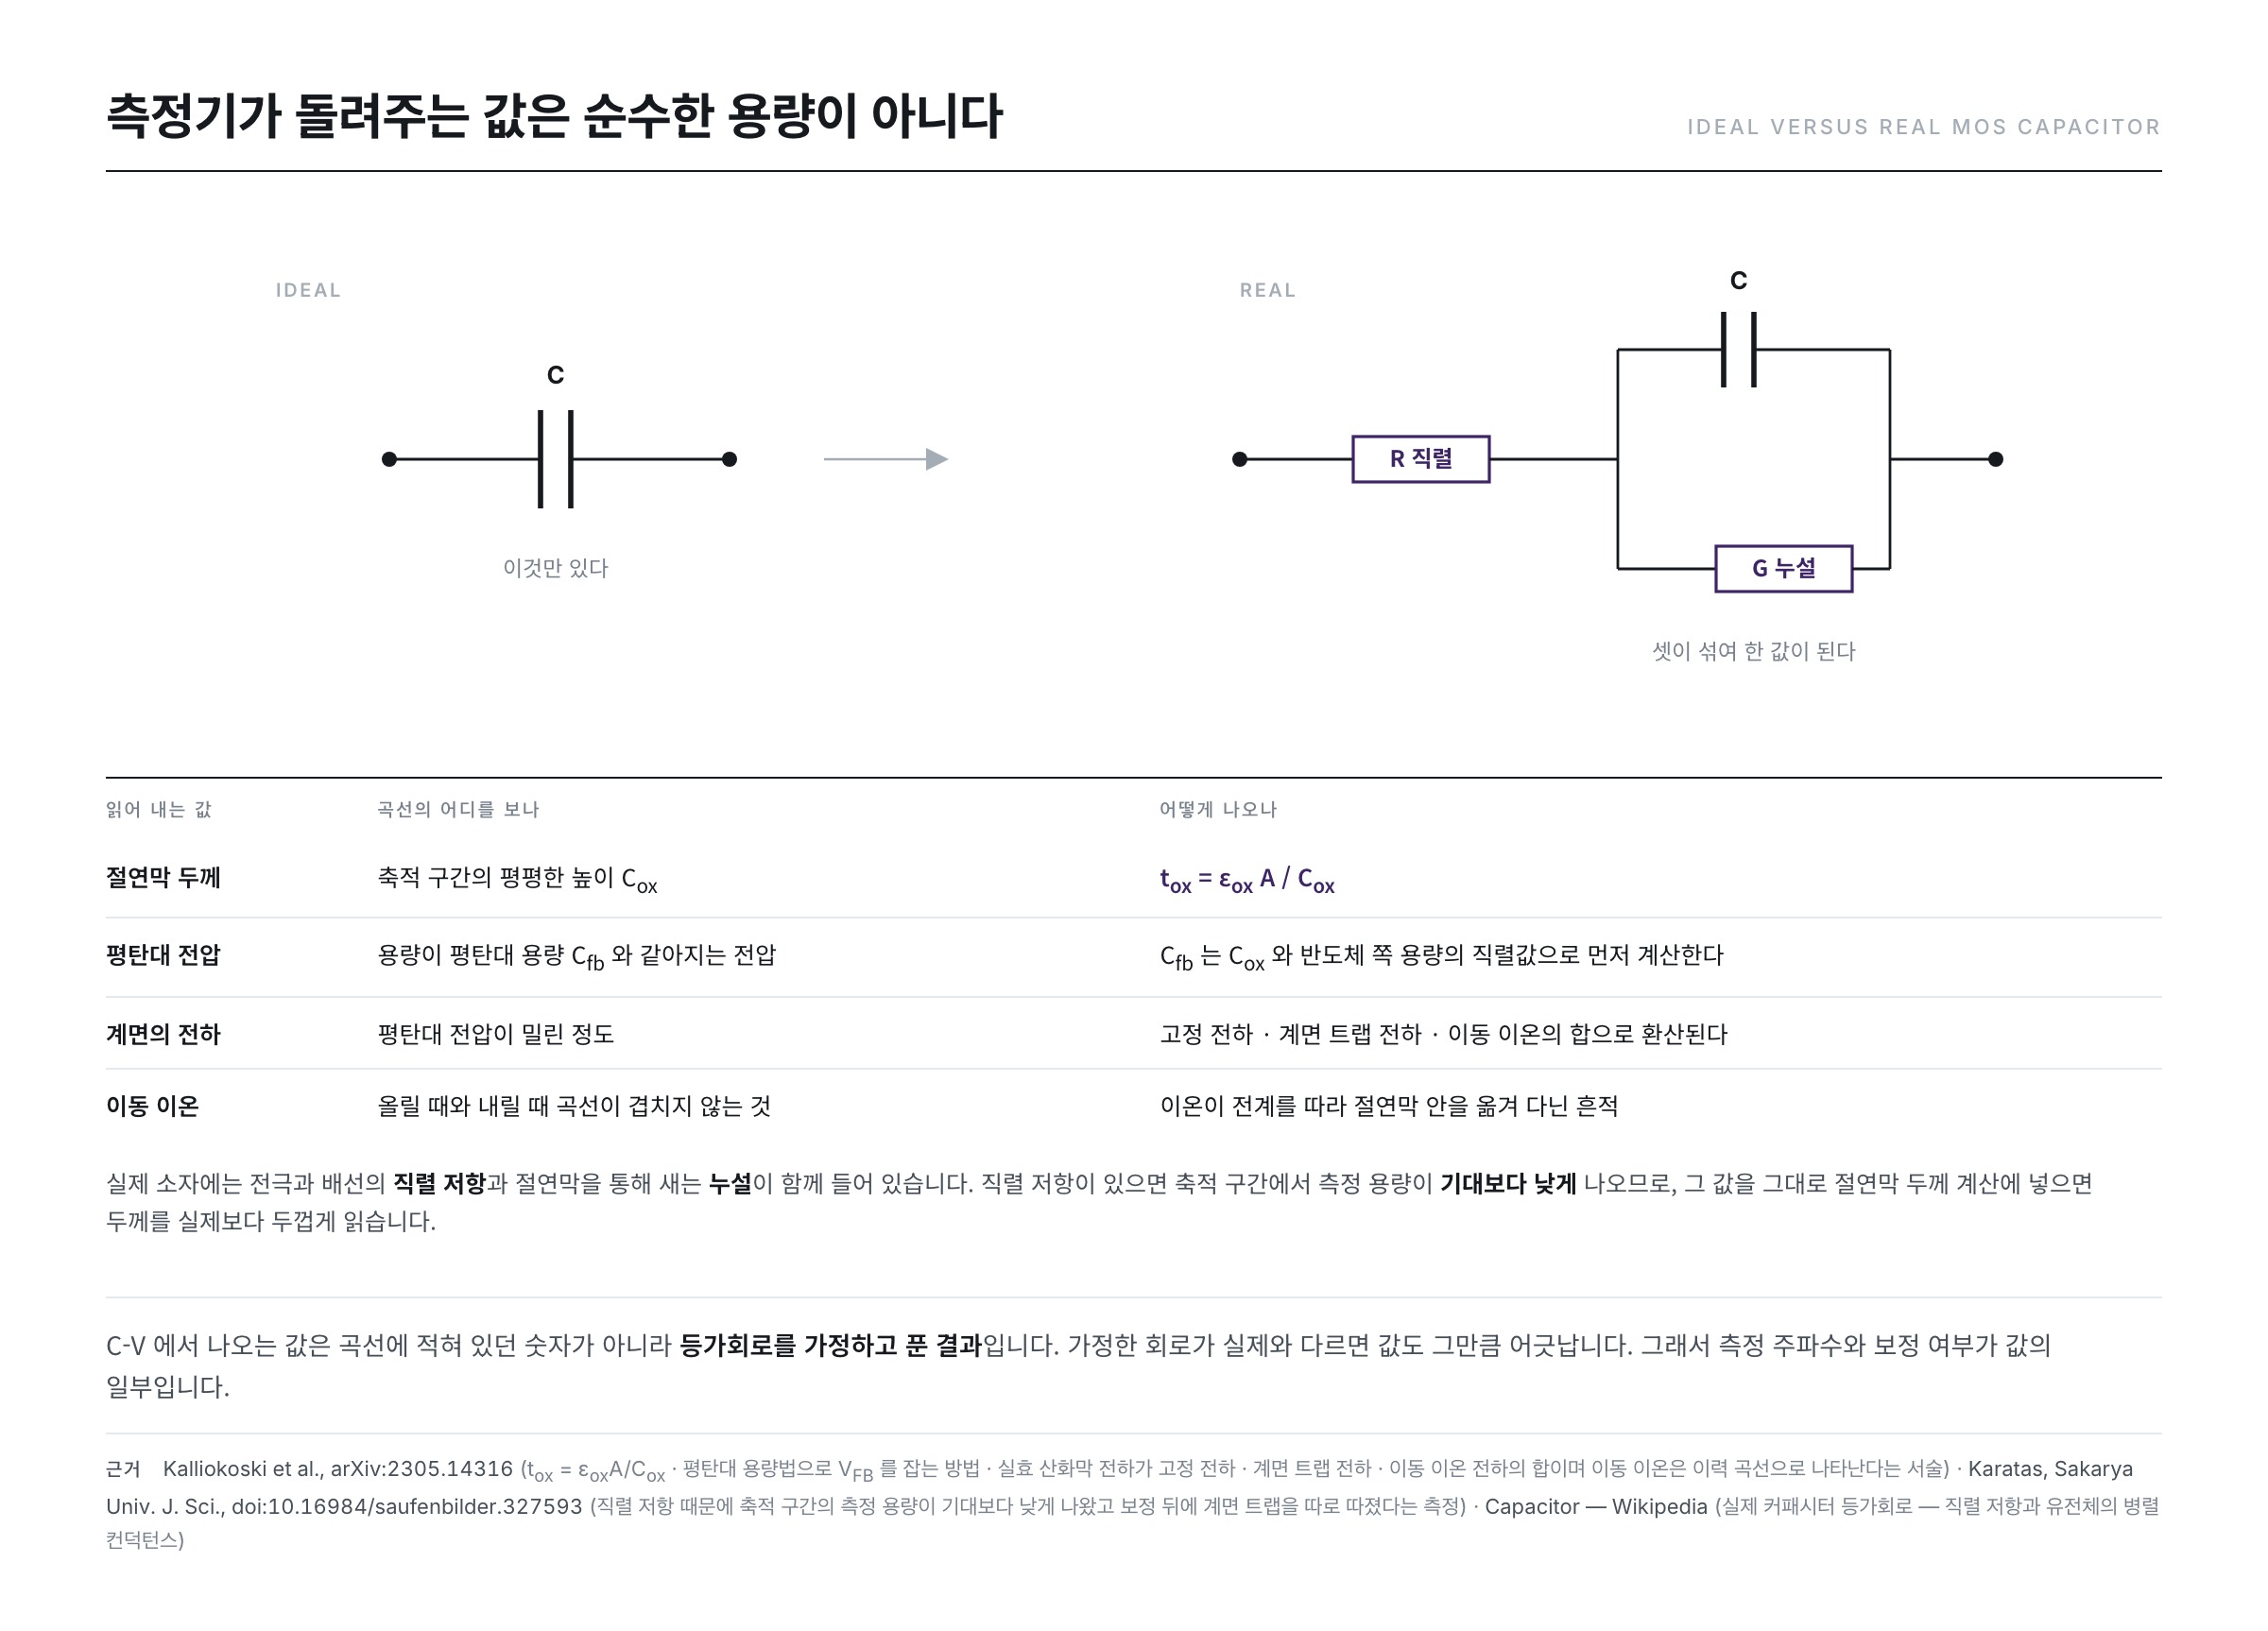
Insulator thickness
arXiv:2305.14316 writes that it extracted the oxide thickness like this.
tox = εox A / Cox
It is C = ε A / d solved for d. Given only the height of the accumulation region and the gate area, the thickness comes out. Tracing back through the assumption above, when the accumulation capacitance of a device of area 10−4 cm2 reads 3.45 pF, the thickness comes back as 100 nm.
Flat-band voltage
The flat-band voltage is the voltage at which the energy bands of the semiconductor do not bend and are in a flat state. arXiv:2305.14316 defines it as the voltage at which the surface potential is zero and writes that the depletion region lies between the threshold voltage and this flat-band voltage.
The way to find it on the curve is the flat-band capacitance method. That value is calculated like this.
Cfb = Cox ( εS A / λ ) ÷ ( Cox + εS A / λ )
λ is the extrinsic Debye length. It has the same form as the series combination seen earlier. Calculate in advance the value of the insulator capacitance joined in series with the semiconductor-side capacitance, then read off the voltage at which the curve reaches that height, and that is the flat-band voltage.
Where that voltage sits gives the next value. arXiv:2305.14316 writes the effective oxide charge density as
Nox = Cox ( WMS − Vfb ) ÷ ( e A )
WMS is the work function difference between metal and semiconductor, and e is the elementary charge. In other words, how far the flat-band voltage has been pushed from the place explained by the work function difference alone is the amount of charge sitting at the interface.
Charge at the interface and mobile ions
That charge is not of one kind. arXiv:2305.14316 divides Nox into the sum of fixed oxide charge, charge trapped at the interface, and mobile ionic charge, and states that since mobile ions travel back and forth between the two interfaces of the insulator according to the electric field, they show up as hysteresis in the C-V curve. If the curve drawn on the way up and the curve drawn on the way down do not overlap, that is the place to be suspicious about.
Interface traps show themselves through frequency. A paper that measured a MOS capacitor using scandium oxide as the insulator at six frequencies from 50 kHz to 1 MHz, doi:10.16984/saufenbilder.327593, writes that the lower the frequency, the more the charge trapped at the interface followed the alternating signal and added to the measured capacitance. The very difference between the low-frequency curve and the high-frequency curve is the trace of the traps.
A real capacitor is not ideal
Everything so far has rested on the premise that the instrument returns a pure capacitance. In reality it does not.
The "Capacitor" article draws the equivalent circuit of a real capacitor like this — to the ideal capacitance are attached, in series, the equivalent series inductance of the leads and a small series resistance, and, in parallel, a small conductance representing the imperfect dielectric. The "Capacitor" article writes that this parallel conductance creates a small leakage current across the dielectric that slowly discharges the capacitor.
The instrument cannot see these three separately. It measures the impedance, fits it to an assumed circuit model, and returns a value converted into a single capacitance.
The doi:10.16984/saufenbilder.327593 paper cited above actually observed that discrepancy. The doi:10.16984/saufenbilder.327593 paper writes that because of the series resistance, the capacitance in the accumulation region of the C-V curve came out lower than expected, and states that only after correcting for the series resistance did it go on to weigh the influence of the interface traps.
Why that is a problem is told by the expression in the previous section. The thickness comes out as tox = εox A / Cox, with Cox in the denominator. Read the accumulation capacitance low and the insulator gets calculated as thicker than it really is. The number that came off the curve carries not the property of the device but the property of the measurement circuit mixed into it.
Summary
- A C-V measurement fixes the surface state with direct current and reads the capacitance of that state with a small alternating current. What the current curve cannot see — the process of the channel being made — is held here.
- The values of the three regions are explained by series combination alone. Accumulation leaves only the insulator and is largest, depletion has the depletion layer joined in series and is smaller, and inversion grows large again once the inversion layer serves as an electrode.
- The curve splits in inversion because generating minority carriers takes time. A slow signal is followed and a fast one is not. Accumulation has no such split.
- Sweep the direct current too fast and no inversion layer can form, so the depletion layer grows past its equilibrium value. That is deep depletion, where the capacitance goes below the minimum value.
- The values that come off the curve — insulator thickness, flat-band voltage, interface charge — are all results obtained by assuming an equivalent circuit and solving. A single series resistance is enough to make the accumulation capacitance read low and the thickness come out thick.
Current shows what happens after it is on; capacitance shows what happens up to the point of turning on. The next installment moves on to the fact that the state of this interface is not a fixed property — the problem that when a device is measured again after being left on for a while, the curve is not where it was.
References
- Capacitance–voltage profiling — Wikipedia : the definition that capacitance is measured while varying the voltage and plotted as a function of voltage, the use of direct current alone or direct current together with a small-signal alternating current, the three regions of accumulation, depletion and inversion, the fact that the low-frequency and high-frequency curves are drawn separately, and the obtaining of oxide thickness, charge, mobile ion contamination and interface trap density
- MOSFET — Wikipedia : the statement that the MOS structure is the same as a planar capacitor, the formation of the depletion and inversion layers, the fact that the left of the C-V curve is accumulation, the middle depletion and the right inversion, the fact that an n-type body has reversed signs, and n = 1 + Cdep/Cox
- Capacitor — Wikipedia : C = εA/d, the series combination expression and the fact that the whole series is smaller than any one of them, the equivalent circuit of a real capacitor (series inductance, series resistance, parallel conductance) and the fact that this conductance creates leakage
- Relative permittivity — Wikipedia : the table of relative permittivities — silicon dioxide 3.9, silicon 11.68
- Vacuum permittivity — Wikipedia : the vacuum permittivity of about 8.854 × 10⁻¹² F/m
- Modeling of Surface Damage at the Si/SiO₂-interface of Irradiated MOS-capacitors (arXiv:2305.14316) : the accumulation layer at zero surface potential, the fact that the measured capacitance in the depletion region is a series combination, the fact that the capacitance is at its minimum when the depletion is at its maximum, the fact that the depletion region lies between Vth and Vfb, tox = εoxA/Cox, the flat-band capacitance method expression for Cfb, the Nox expression and its three components, the hysteresis of mobile ions, and the observation that at low frequency the inversion capacitance rises towards Cox
- Charge carrier inversion in a doped thin film organic semiconductor island (arXiv:2008.01562) : the fact that the capacitance depends on frequency only in the inversion region, the fact that the cause is the finite lifetime and generation time of the minority carriers, and the measurement that those times were on the scale of tens of microseconds
- Minority-Carrier-Generation-Limited Deep-Depletion Behavior in n-Type Silicon MOS Capacitors, ECS : the fact that slow minority carrier generation unable to sustain inversion leads into deep depletion, the observation that strong deep depletion appeared at 1 MHz, and the depletion width expression
- Effects of interface states and series resistance on the electrical characteristic of Sc₂O₃ MOS capacitor : measurements at six frequencies from 50 kHz to 1 MHz, the fact that the accumulation-region capacitance came out lower than expected because of the series resistance and that the interface traps were weighed only after correction, and the fact that the lower the frequency the more the trapped charge followed the alternating current
- MOS Deep depletion C-V measurements using linear ramp voltages, IEDM 1969 : the measurement of deep depletion C-V with linear ramp voltages
- ※ The portions quoted from Wikipedia articles in the list above are licensed under CC BY-SA 4.0.