The previous installment dealt with the C–V curve. It was the story of how measuring capacitance brings out what cannot be known from current alone.
This installment looks at what those curves were reflecting in the end. In the earlier series it was said that an electron cannot stay inside the band gap. The Wikipedia "Band gap" article too defines the band gap as the range of energy in a solid where no electronic states exist.
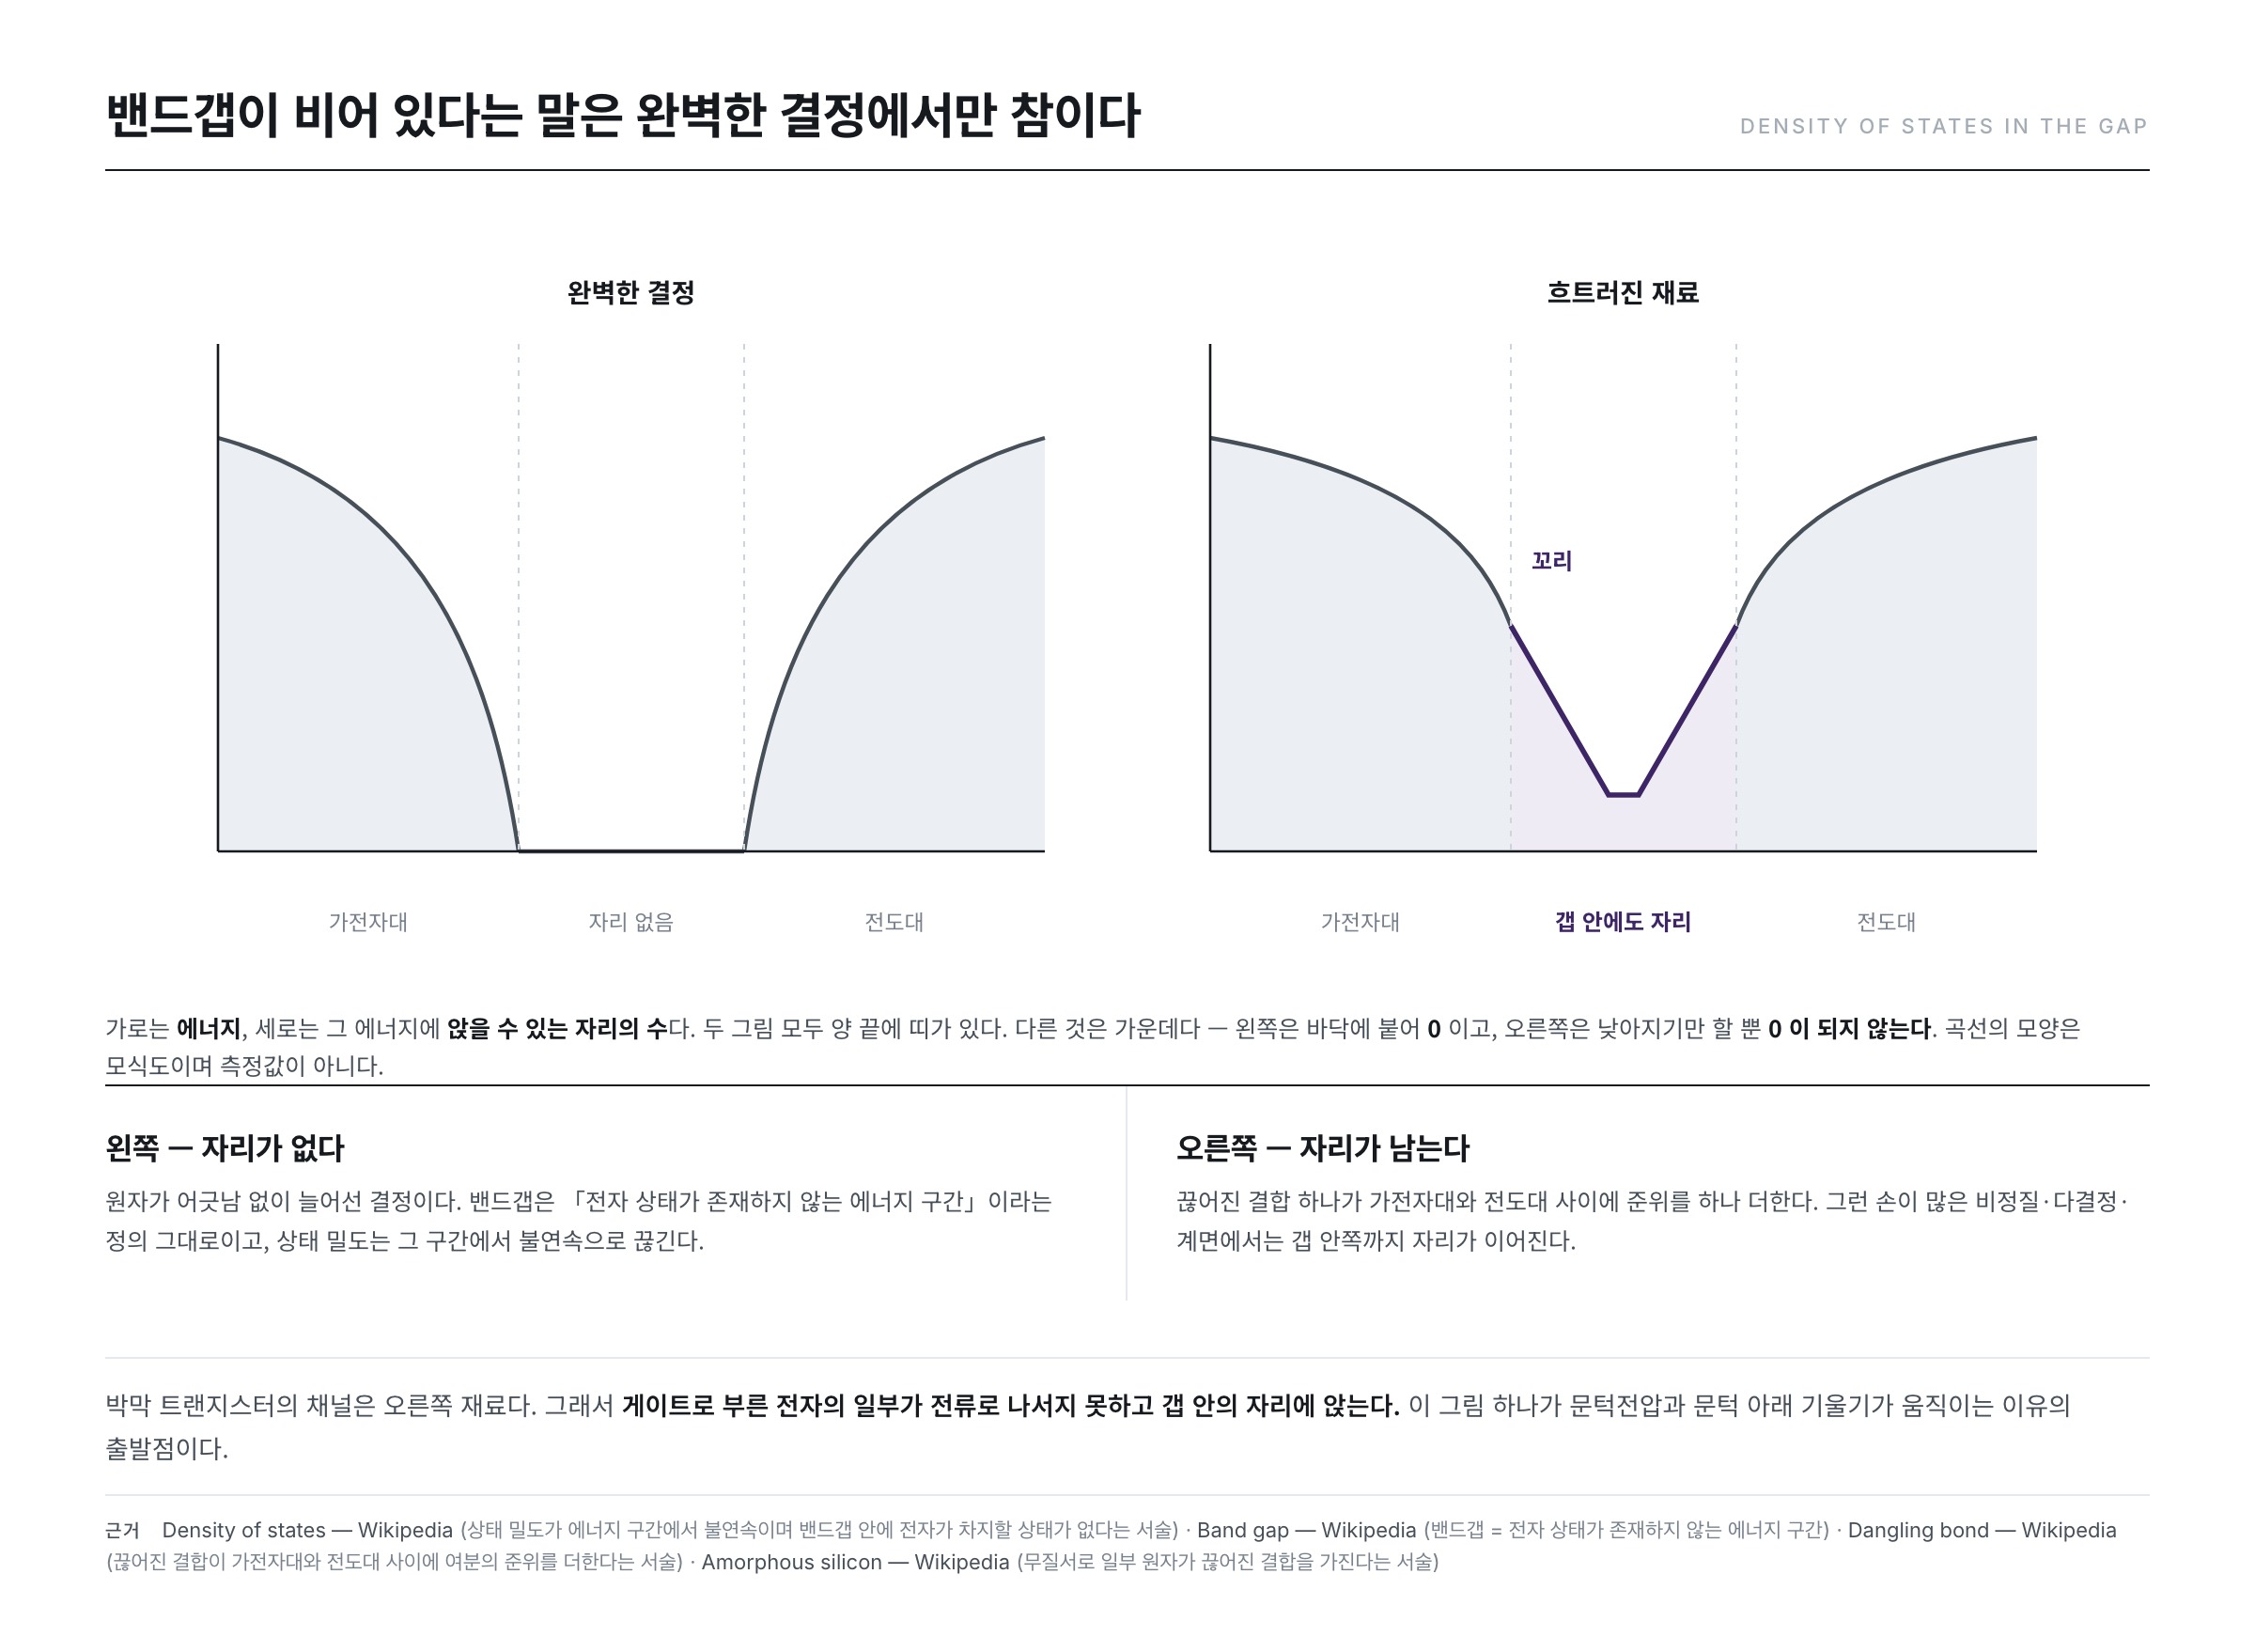
That is the story of a perfect crystal. The channel of a thin-film transistor is not such a material. In a material whose arrangement is disturbed, seats appear inside the band gap as well. What records how densely those seats sit along the energy axis is the DOS (Density of States).
The condition values in the text are examples meant to show how the calculation goes, not the specifications of any particular company. Every figure quoted was checked in the open literature, and the sources are left at the end of the article.
Density of states — how many seats there are
The meaning is simple. The Wikipedia "Density of states" article defines the density of states as the quantity describing how many allowed states there are per unit energy interval. It is written divided by volume as D(E) = N(E)/V, and in three dimensions the unit is [energy]−1[volume]−1.
It is close to a seating chart. With energy along the horizontal axis, it is a picture stacking up vertically how many seats can be taken at that energy. That a seat exists and that an electron is sitting in it are two different things, and the density of states speaks only of the former.
The "Density of states" article goes on to write that the density of states is discontinuous over certain energy intervals, and that this means there are no states available for electrons to occupy within the band gap of the material.
So the density-of-states picture of a perfect crystal is clear. There are plenty of seats on the valence band side and the conduction band side, and in between it lies flat on the floor. Not few, but none.
Disturb the arrangement and seats appear inside the gap too
What happens when the atoms are not in their places? The most common thing is a dangling bond. The Wikipedia "Dangling bond" article defines it as an unsatisfied valence left on an immobilized atom. A hand left alone, unable to find its partner. The "Dangling bond" article carries the sentence that is the starting point of this installment.
A single dangling bond adds one extra energy level between the valence band and the conduction band of the lattice.
It means that a seat appears in an interval that ought to be empty. Where there are many such hands there are many such seats, and the shape in which they spread along the energy axis is the density of states inside the gap. The materials with many such hands are settled ones.
- Amorphous — the Wikipedia "Amorphous silicon" article writes that because of the disordered nature of the material some atoms have dangling bonds, and states that these can cause anomalous electrical behaviour.
- Polycrystalline — the boundaries where grains meet cannot be as orderly as their interiors. The Wikipedia "Thin-film transistor" article carries, among its related literature, studies that extract trap states at the interface and the grain boundaries of polycrystalline silicon TFTs.
- Interface — the face where the channel meets the gate insulator is also a place where the arrangement is cut off.
There is a way to fill them. The "Amorphous silicon" article states that this material can be passivated by hydrogen, which lowers that density by several orders of magnitude. It also carries, however, the sentence that this hydrogenation is connected with light-induced degradation known as the Staebler–Wronski effect.
Tails and deep seats
The seats inside the gap divide into two groups according to where they are.
Tail states — what has run down from the edges
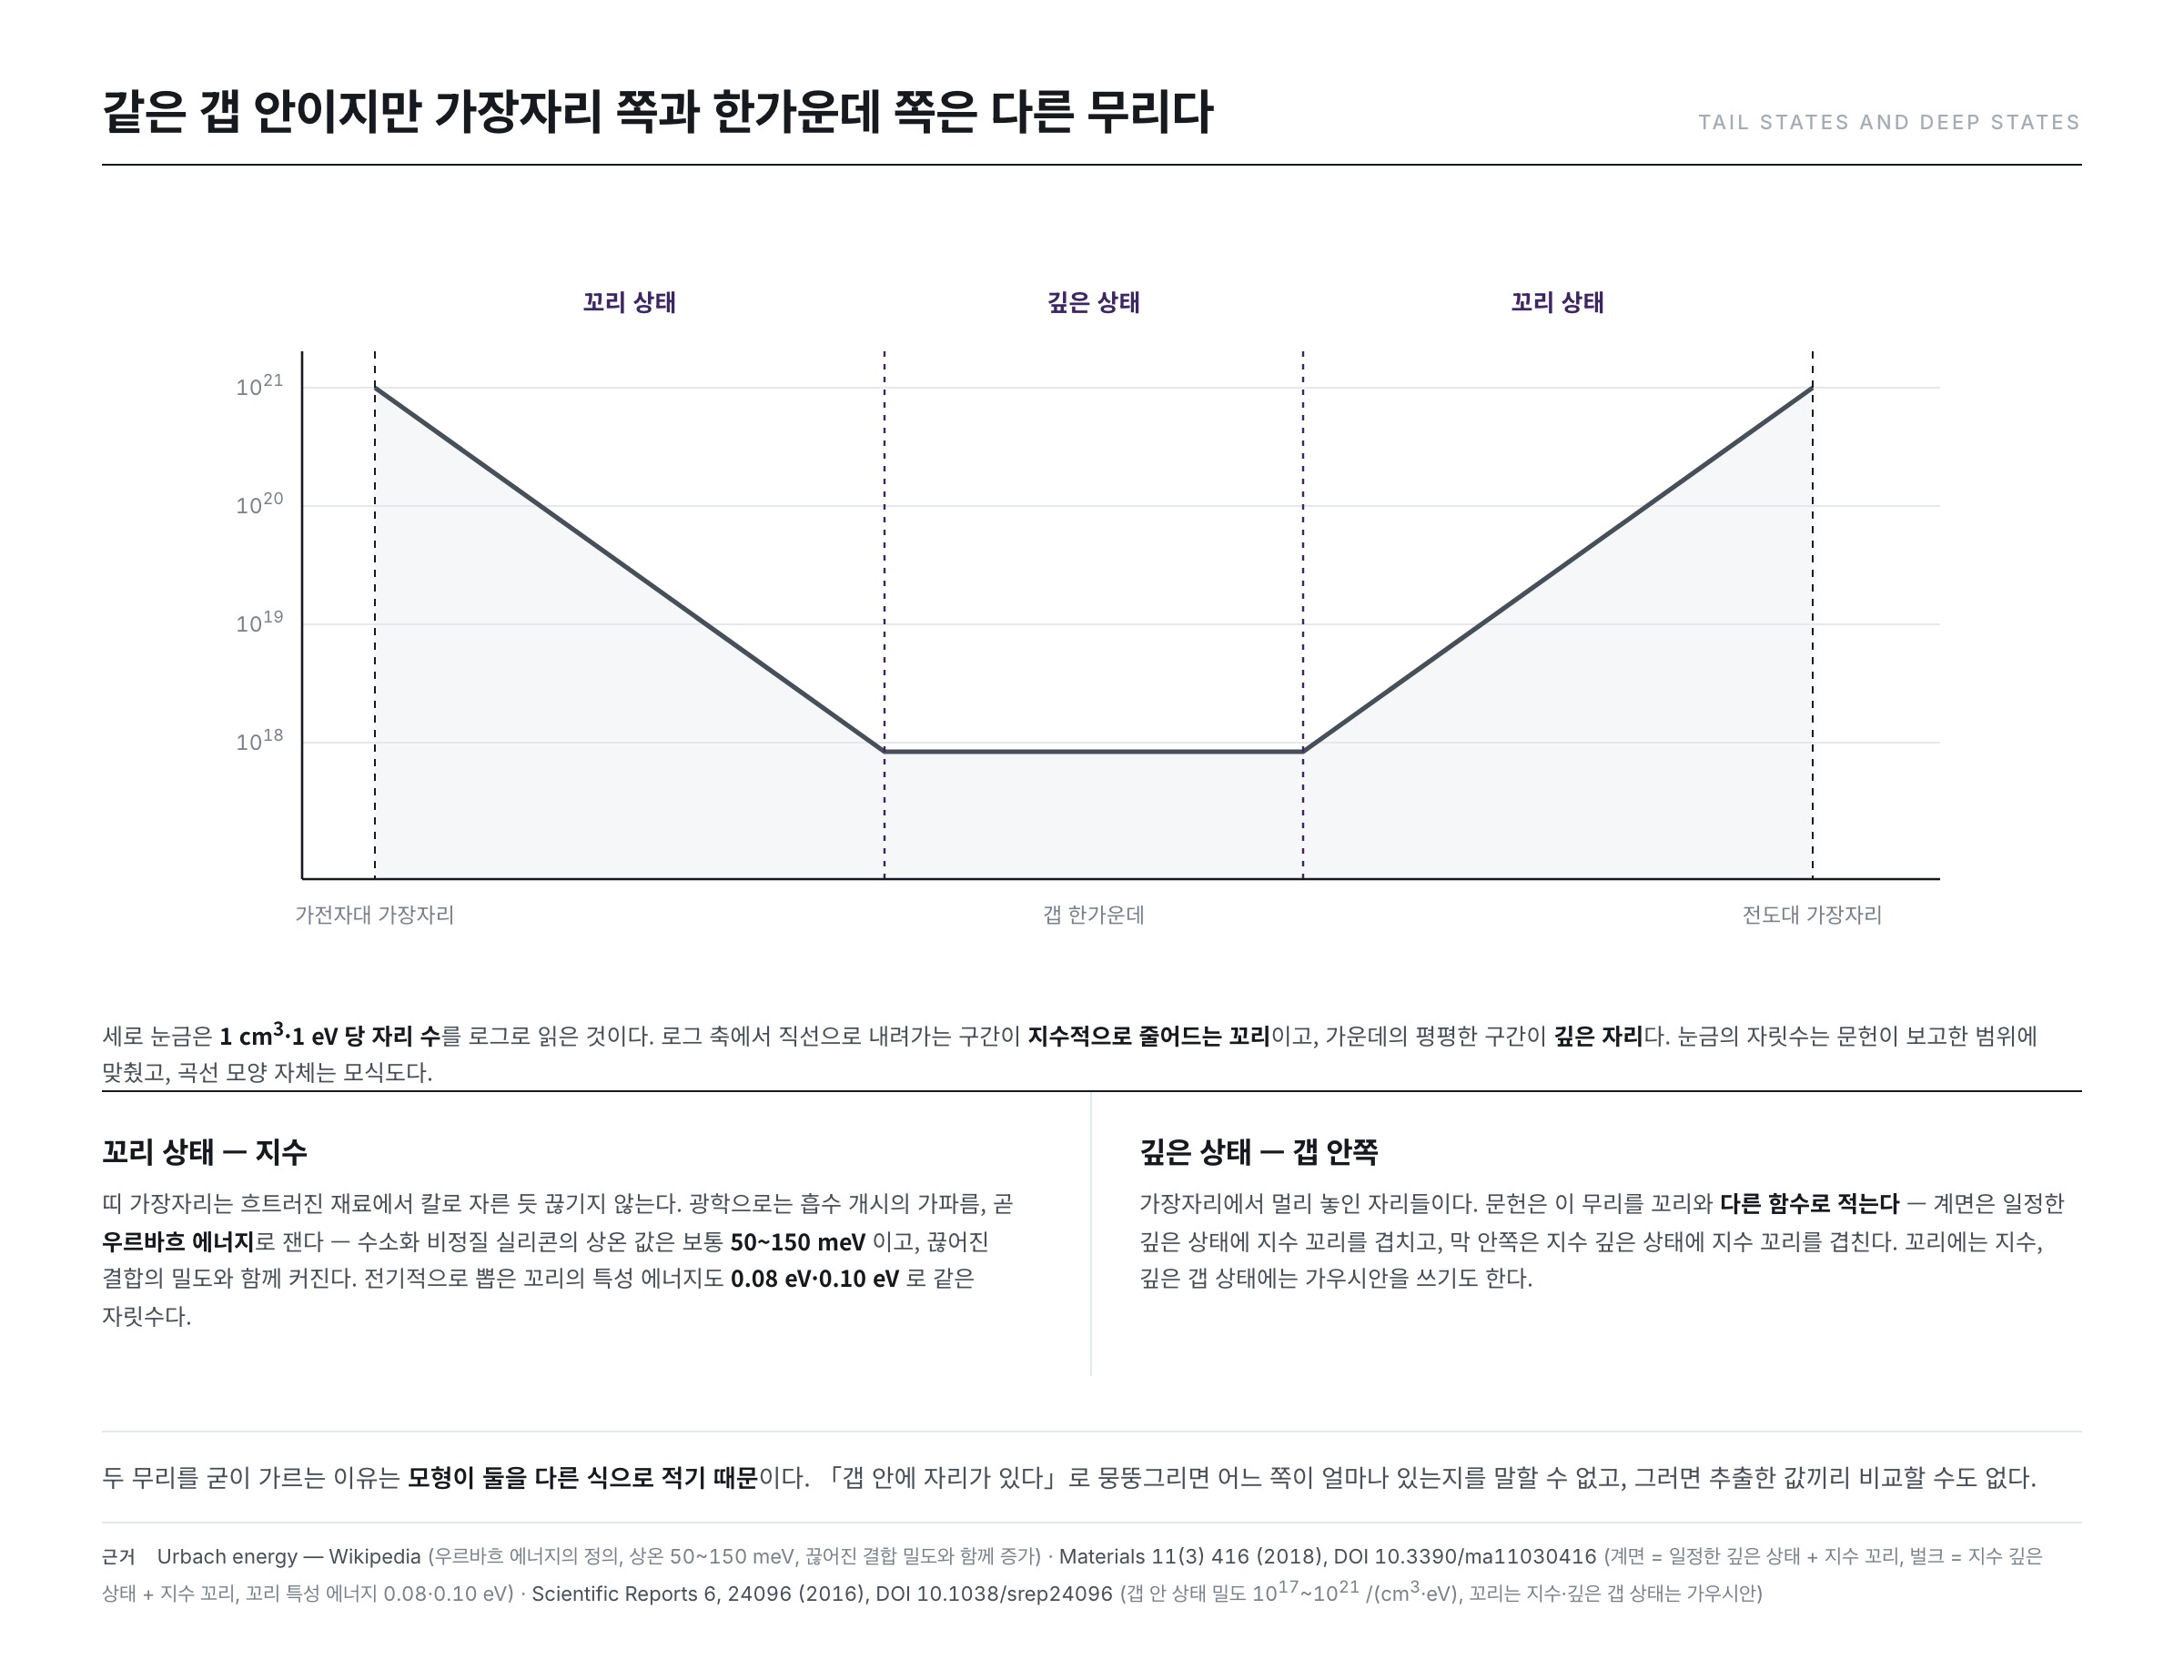
In a disturbed material the edge of a band is not cut off as if by a knife. It reaches into the gap, falling away exponentially. On a logarithmic scale it goes down as a straight line, and this is the tail state.
The length of this tail has a name. The Wikipedia "Urbach energy" article defines the Urbach energy E0 as a parameter quantifying the energetic disorder at the band edge of a semiconductor. It expresses the steepness at the point where light absorption begins, and the article writes that this is precisely how widely the density of states is spread.
α(E) = α0 exp( (E − E1) / E0 )
There are numbers too. The "Urbach energy" article writes that the room-temperature E0 of hydrogenated amorphous silicon is typically 50~150 meV, and states that this value increases together with the density of dangling bonds. The saying that the greater the disorder, the longer the tail is thereby confirmed in numbers.
Deep states — towards the middle of the gap
The seats towards the middle of the gap are called deep states separately. The reason the literature divides the two is that they are written as different functions in the models. The Materials 2018 paper (DOI 10.3390/ma11030416), which extracted the density of states of an oxide thin-film transistor, writes as follows.
- The density of states at the interface — a superposition of constant deep states and exponential tail states
- The density of states in the bulk (inside the film) — a superposition of exponential deep states and exponential tail states
The characteristic energies of the tails that the Materials 2018 paper extracted were 0.08 eV on the interface side and 0.10 eV inside the film. That is the same order as the Urbach energy of 50~150 meV above. What was measured with light and what was extracted with electricity are of similar size.
The scale is given as well. The Scientific Reports 2016 paper (DOI 10.1038/srep24096) writes that this density of states is largest at the edges of the band gap and on the scale of 1017~1021 /(cm3·eV), and states that an exponential distribution is used for the tails and a Gaussian distribution for the deep gap states.
There is an example of a deep seat as well. arXiv 2111.08588 deals with hydrogen inside an amorphous oxide semiconductor and states that the defect complex that forms creates, inside the band gap, a distribution of states centred 0.4 eV above the valence band edge with a width of about 0.3 eV.
The numbers of #04 and #05 were shadows of this distribution
That is the material side of the story. Now for the centre of this installment. It is the story that the parameters read earlier were in fact this one distribution seen differently. Apply a voltage to the gate and electrons gather in the channel. But not all of the gathered electrons step forward as current. If there are seats inside the gap, some of them sit down there, and an electron that has sat down cannot flow. The consequences run in two directions.
The threshold voltage moves
For a current to flow noticeably, the seats inside the gap have to be filled first. The more seats there are, the more voltage it takes, and the threshold voltage is pushed by that much. The Materials 2018 paper writes that the electrical characteristics of an oxide thin-film transistor are greatly affected by the bulk density of states of the active layer and by the density of states at the interface.
The subthreshold slope reclines
Let us take out the expression from #05 again. The Wikipedia "Subthreshold slope" article wrote the subthreshold swing like this.
S = ln(10) · (kT/q) · (1 + Cd/Cox)
It also writes that if Cd goes to 0 or Cox becomes very large, the lower bound of 60 mV/decade at a room temperature of 300 K is reached. Put the seats inside the gap in and one more term appears. arXiv 2509.20014, which deals with gate insulators, carries the form including the interface state density Dit.
SS = log(10) · (kBT/q) · (Cins + Csc + q2Dit) / Cins
q2Dit is in the numerator. The more seats inside the gap, the more the slope reclines. arXiv 2509.20014 writes that for a target below 65 mV/decade, Dit has to be below 1012 cm−2eV−1.
Let us substitute numbers to see how heavy a figure that is. This article assumes a gate insulator of silicon dioxide 100 nm thick in its calculations. It uses the relative permittivity from the Wikipedia "Relative permittivity" article, 3.9, the vacuum permittivity from the "Vacuum permittivity" article, 8.854 × 10⁻¹² F·m−1, and the elementary charge 1.602 × 10⁻¹⁹ C.
- insulator capacitance — Cox = 3.9 × 8.854 × 10−12 ÷ (100 × 10−9) ≈ 3.45 × 10⁻⁴ F/m2 = 3.45 × 10⁻⁸ F/cm2
- the interface states' share — with Dit = 1 × 1012 cm−2eV−1, q·Dit ≈ 1.60 × 10⁻⁷ F/cm2
- the ratio — 1.60 × 10⁻⁷ ÷ 3.45 × 10⁻⁸ ≈ 4.6
Setting Csc to 0 gives SS ≈ 60 mV/decade × (1 + 4.6) ≈ about 340 mV/decade. More than five times the lower bound. The phenomenon written down in #05 as nothing more than "the slope reclines" becomes here a number that came out of the count of seats inside the gap.
Mobility points to the same place
In #06 it was said that mobility is not one thing. The seats inside the gap are entangled here too. The "Urbach energy" article states that the behaviour of a disordered semiconductor is governed by multiple trapping and release mechanisms. It means that the electron passes through being caught and released over and over. If so, the mobility obtained by measuring from outside is a value that includes all of that repetition.
To put it together, the threshold voltage of #04, the subthreshold slope of #05 and the mobility of #06 are not three different properties. They are the shadows of one distribution cast through three windows.
How the DOS is found out
It would seem enough to look at that distribution directly. The problem is that it cannot be seen. The seats inside the gap carry no scale markings.
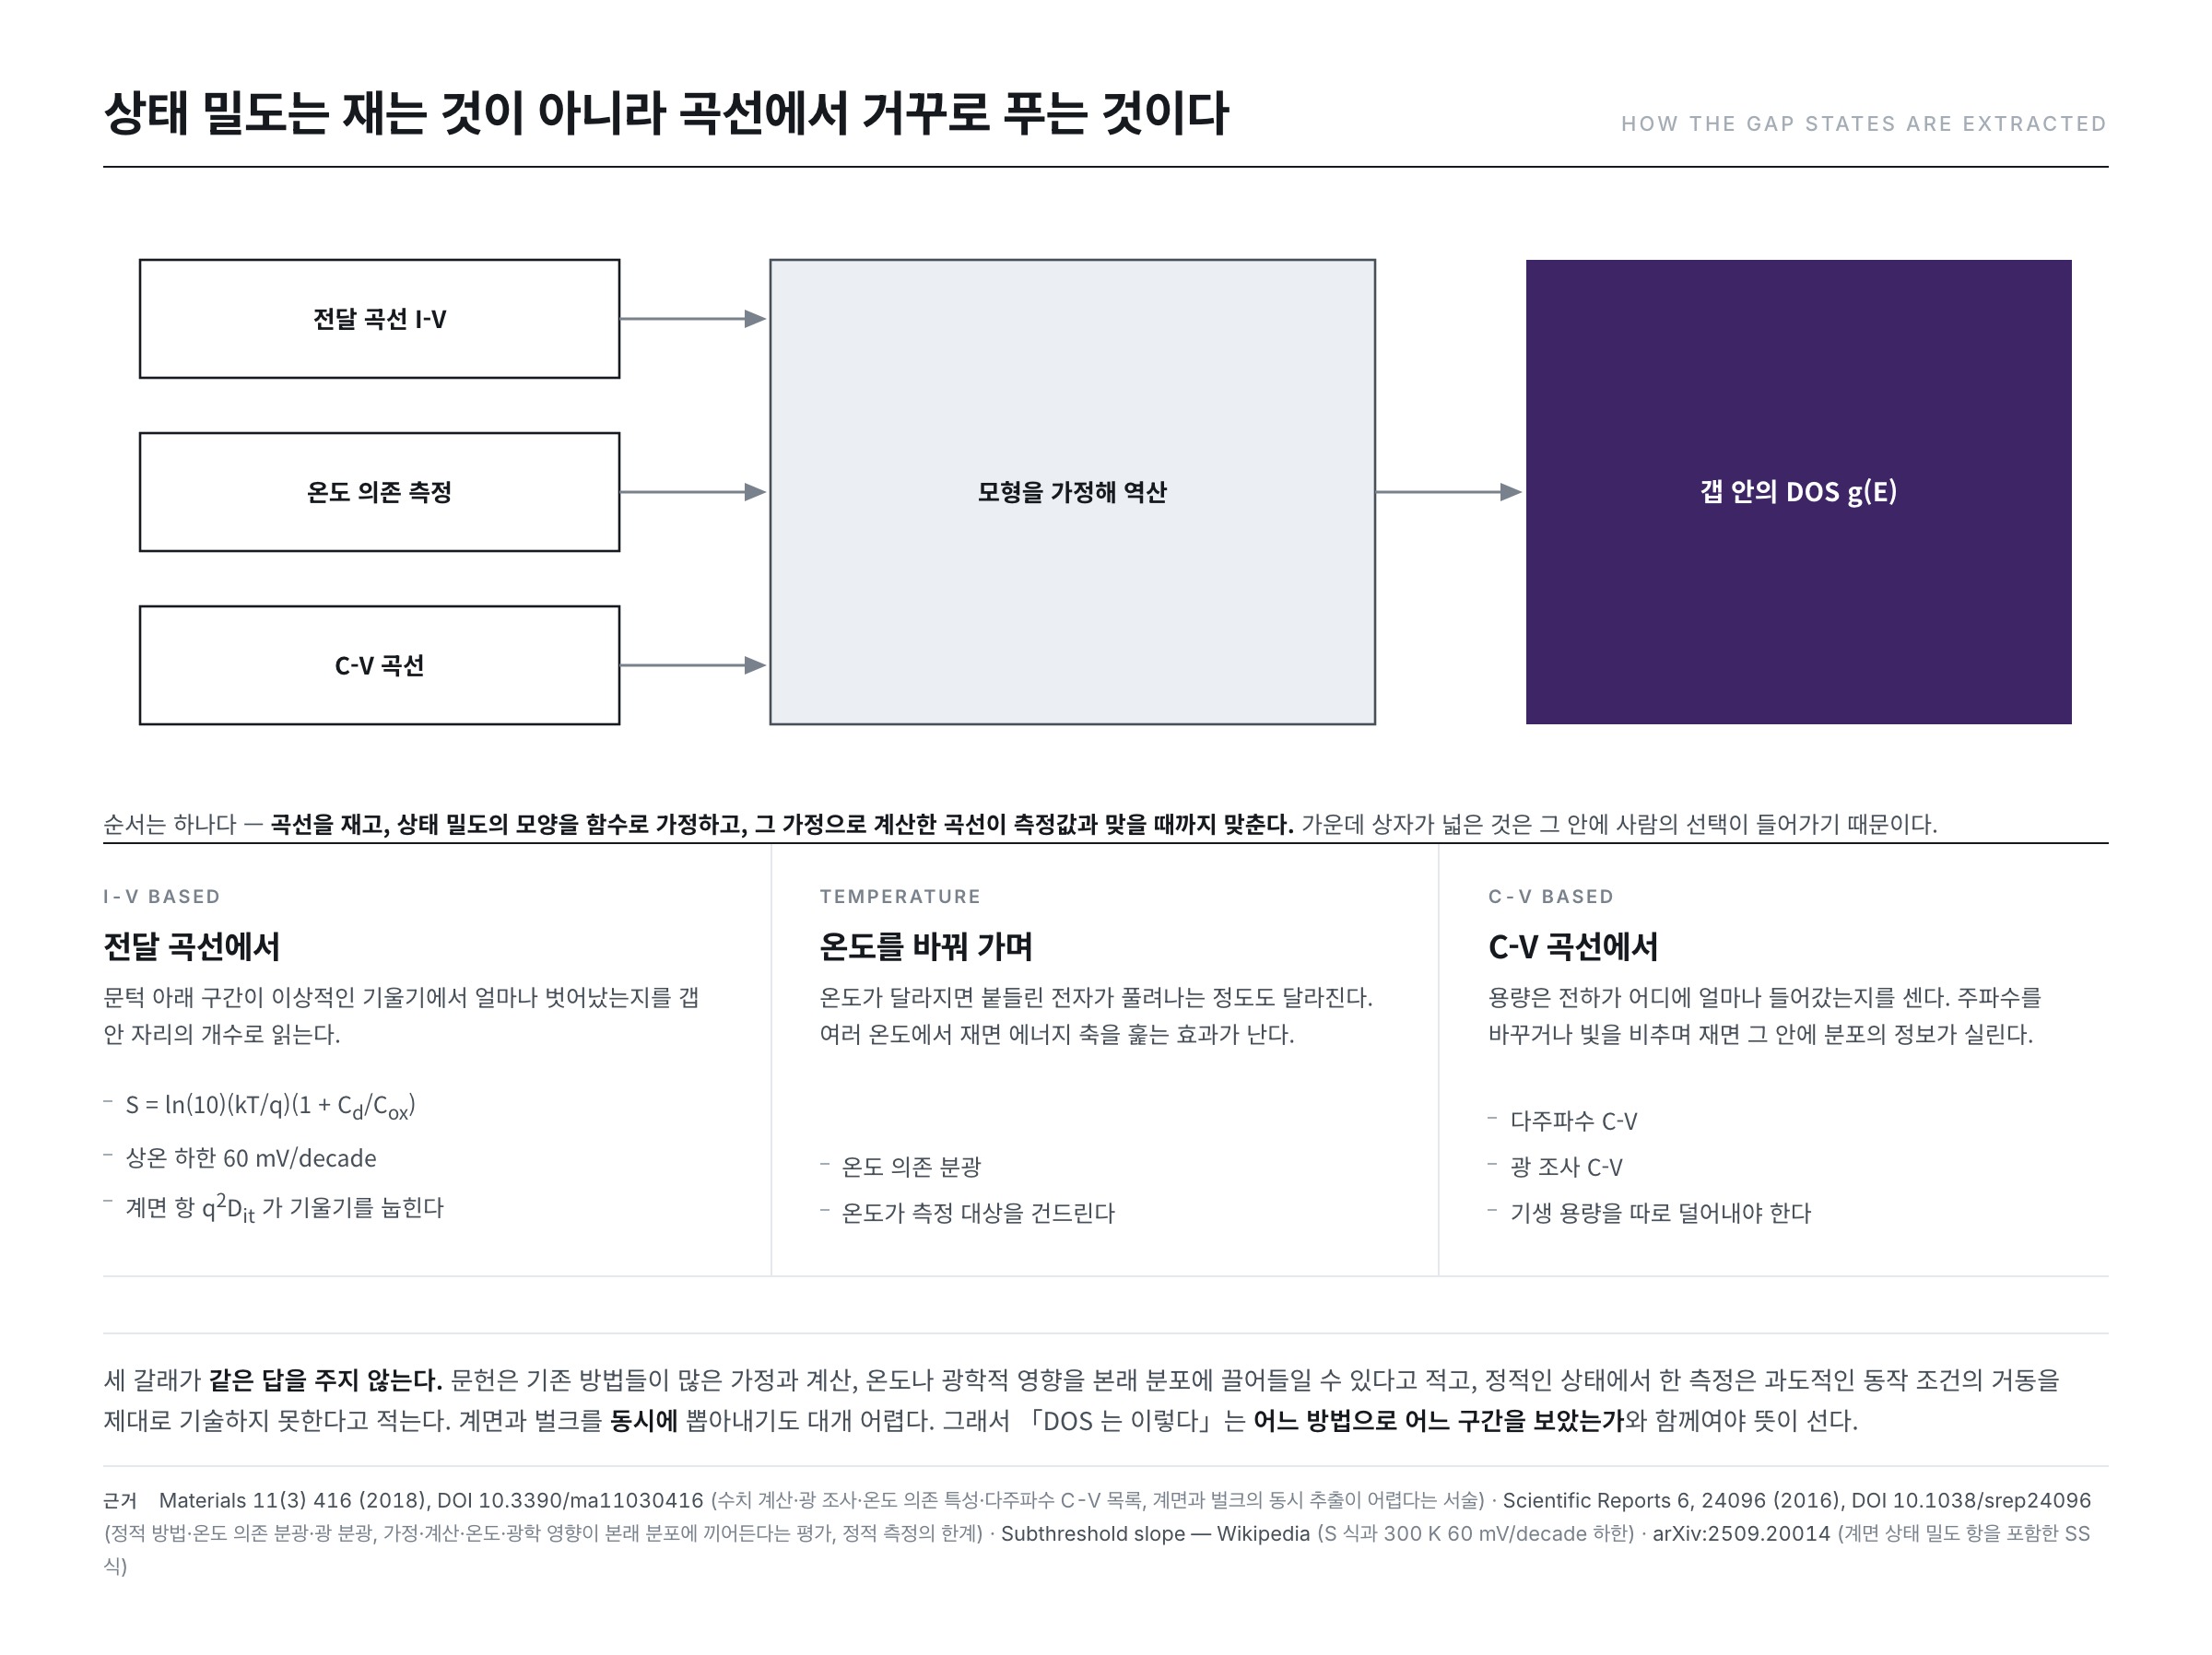
So the direction is reversed. It is solved backwards from a curve that can be measured — measure the curve, assume a function for the shape of the density of states, and fit until the curve calculated from that assumption matches the measurement.
Which curve is used is what divides the methods. The Materials 2018 paper lists numerical calculation, optical irradiation, temperature-dependent characteristics, and multi-frequency C–V, while the Scientific Reports paper names static methods, temperature-dependent spectroscopy, and optical spectroscopy. By character alone there are three branches.
- From the transfer curve — the curve of #02 and #05. How far the subthreshold region departs from 60 mV/decade points at the count of seats inside the gap. The expression in the previous section is the passage through.
- By varying the temperature — change the temperature and the degree to which trapped electrons are released changes too. Measuring at several temperatures has the effect of sweeping the energy axis.
- From the C–V curve — the curve of the previous installment. Capacitance counts how much charge went in and where, so measuring while varying the frequency or shining light on it loads the reading with information about the density of states.
Different methods give different answers
Here the conclusion of #03 comes out again. Namely, that a parameter is a defined value.
The Scientific Reports paper assesses that the established methods can drag many assumptions and calculations, and temperature or optical influences, into the original distribution of the density of states. It means that the conditions brought in to measure disturb the very thing being measured. The Scientific Reports paper also points to the time scale, writing that a measurement made in a static state does not properly describe the electrical behaviour under transient operating conditions.
Where one looks divides things too. The Materials 2018 paper, while writing that both the interface and the bulk govern the characteristics, states that extracting the two at the same time is generally difficult.
So "the DOS of this material is such-and-such" does not stand on its own. It becomes comparable only once it is stated together by which method, over which energy interval, and on which time scale it was seen. If a value extracted from a transfer curve differs from one extracted from C–V, it need not be that one of them is wrong — they may have looked at different things.
Summary
- The density of states is how many seats can be taken at a given energy, per unit volume and per unit energy. Inside the band gap of a perfect crystal it is 0.
- Disturb the arrangement and it changes. A single dangling bond adds one level between the valence band and the conduction band. Many such seats arise in amorphous and polycrystalline material and at interfaces.
- The seats inside the gap divide into tails reaching out from the band edges and deep seats towards the middle of the gap, and the literature writes the two as different functions.
- The threshold voltage of #04 and the slope of #05 are shadows cast by this distribution. Assuming an interface state density of 1012 cm−2eV−1 with 100 nm of silicon dioxide, the slope reclines to about 340 mV/decade.
- The density of states cannot be seen directly, so it is solved backwards from curves. Each method differs in its assumptions, energy interval and time scale, so different answers come out.
This series ends here. The axis was changed from the output curve (#01) to the transfer curve (#02), and it was confirmed that the numbers on it come not from measurement but from convention (#03). On top of that convention, the threshold voltage and gm (#04), the subthreshold slope and the on·off ratio (#05), and mobility and contact resistance (#06) were drawn out, and with C–V we saw what current cannot see (#07). In this installment it was confirmed that all of those numbers were pointing at one single distribution.
The next series, "TFT Characteristic Anomalies and Reliability", follows how these numbers, treated so far as fixed values, move as they undergo time and stress.
References
- Density of states — Wikipedia : the definition of the density of states and D(E) = N(E)/V, the three-dimensional unit, and the statement that there are no states for electrons to occupy inside the band gap
- Band gap — Wikipedia : the sentence defining the band gap as "the range of energy in a solid where no electronic states exist"
- Dangling bond — Wikipedia : the definition of the dangling bond, the statement that it adds an extra level between the valence band and the conduction band, and the high concentration in amorphous silicon
- Amorphous silicon — Wikipedia : the statement that disorder leaves some atoms with dangling bonds, the statement that hydrogen passivation lowers the density by several orders of magnitude, and the Staebler–Wronski effect
- Urbach energy — Wikipedia : the definition of the Urbach energy and the absorption expression, the room-temperature value of 50~150 meV, the statement that it increases with the density of dangling bonds, and the mention of multiple trapping and release
- Subthreshold slope — Wikipedia : S = ln(10)(kT/q)(1 + Cd/Cox) and the 60 mV/decade lower bound at 300 K
- Thin-film transistor — Wikipedia : the list of literature on extracting trap states at the interface and grain boundaries of polycrystalline silicon TFTs
- Relative permittivity — Wikipedia : the relative permittivity of silicon dioxide, 3.9
- Vacuum permittivity — Wikipedia : the vacuum permittivity 8.8541878188 × 10⁻¹² F·m−1 and the elementary charge 1.602176634 × 10⁻¹⁹ C
- Materials 11(3) 416 (2018), DOI 10.3390/ma11030416 : interface = constant deep states + exponential tail, bulk = exponential deep + exponential tail, tail characteristic energies of 0.08·0.10 eV, the list of extraction methods and the difficulty of simultaneous extraction
- Scientific Reports 6, 24096 (2016), DOI 10.1038/srep24096 : the scale of 1017~1021 /(cm3·eV), exponential for the tails and Gaussian for the deep states, the assessment that established methods drag in assumptions, temperature and optical influences, and the limits of static measurement
- arXiv:2111.08588 : a distribution of states centred 0.4 eV above the valence band edge with a width of about 0.3 eV
- arXiv:2509.20014 : the SS expression including the interface state density term q2Dit, and the Dit < 1012 cm−2eV−1 needed for below 65 mV/decade
- ※ The portions quoted from Wikipedia articles in the list above are licensed under CC BY-SA 4.0.